Overview
iLepBase is a comprehensive global resource for Lepidoptera, including eight data modules: taxonomy, genome, transcriptome, protein structure, Barcode, distribution, host plants and literature. In addition, iLepBase also provides multiple online tools for Lepidoptera research, including barcode sequence search (BLAST), genome assembly visualization (JBrowse), protein structure visualization (Mol* Viewer), multimodal species identification (MMNet) and niche-integrated DNA barcoding for species identification (NicheBarcoding).
1Home
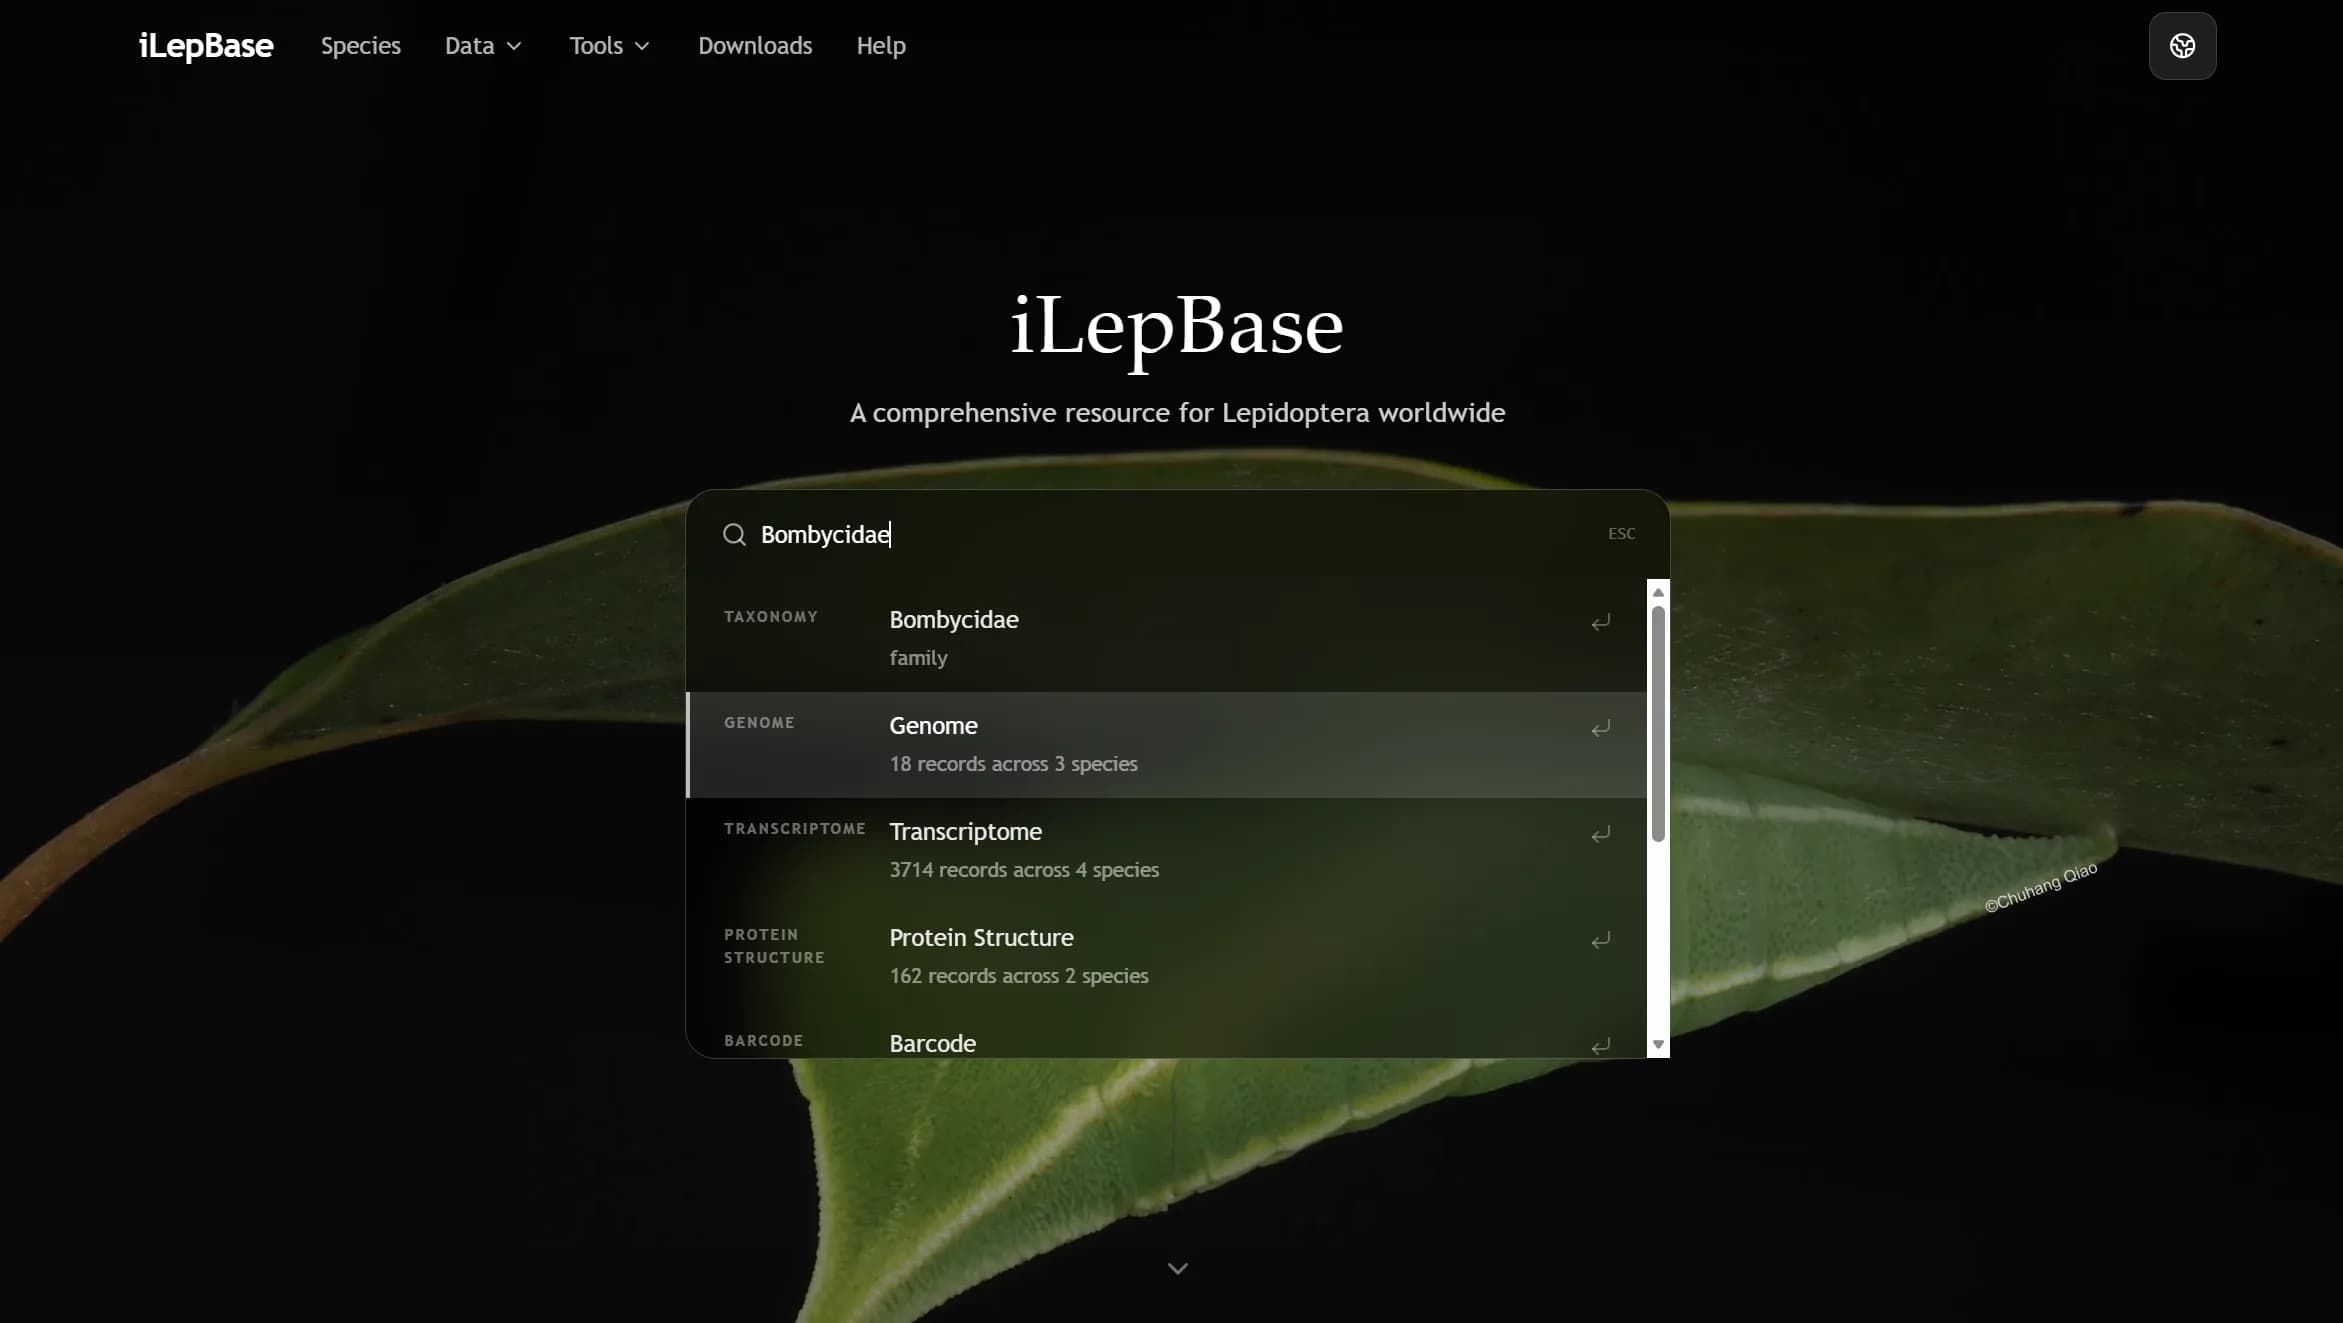
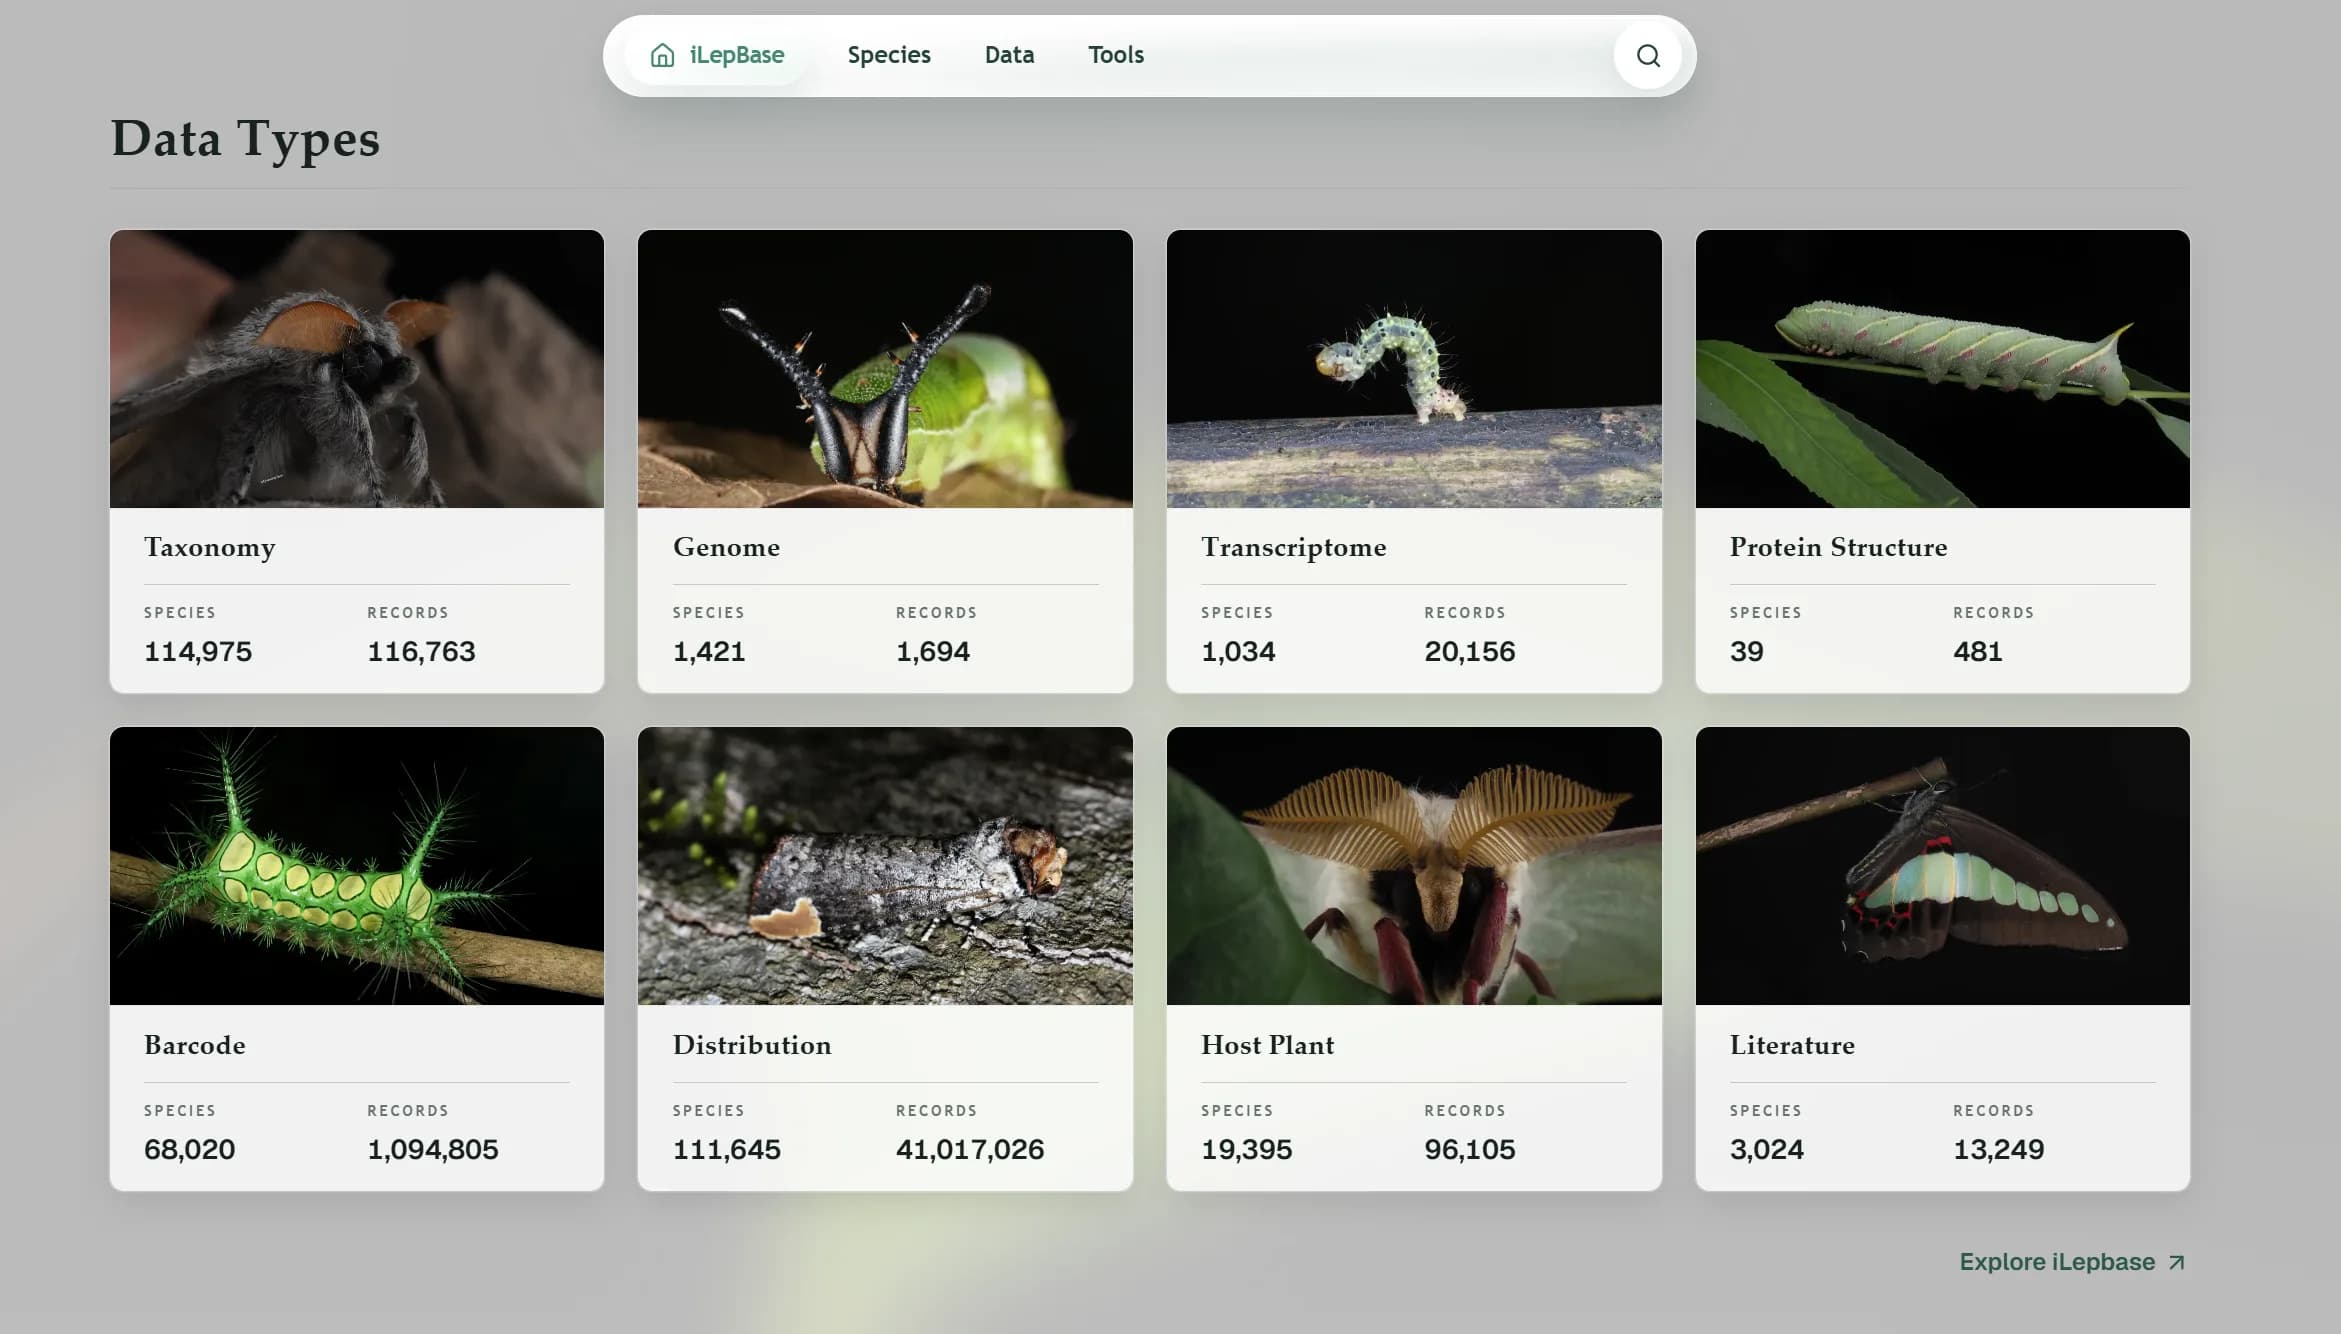
The homepage displays the data types provided by iLepBase. Each entry can be clicked to access the corresponding analysis page, while the top navigation bar provides fast access to all datasets and tools.
2Data
iLepBase provides eight data modules for Lepidoptera research.
The data modules include taxonomy, genome, transcriptome, protein structure, Barcode, distribution, host plants and literature.
2.1Taxonomy
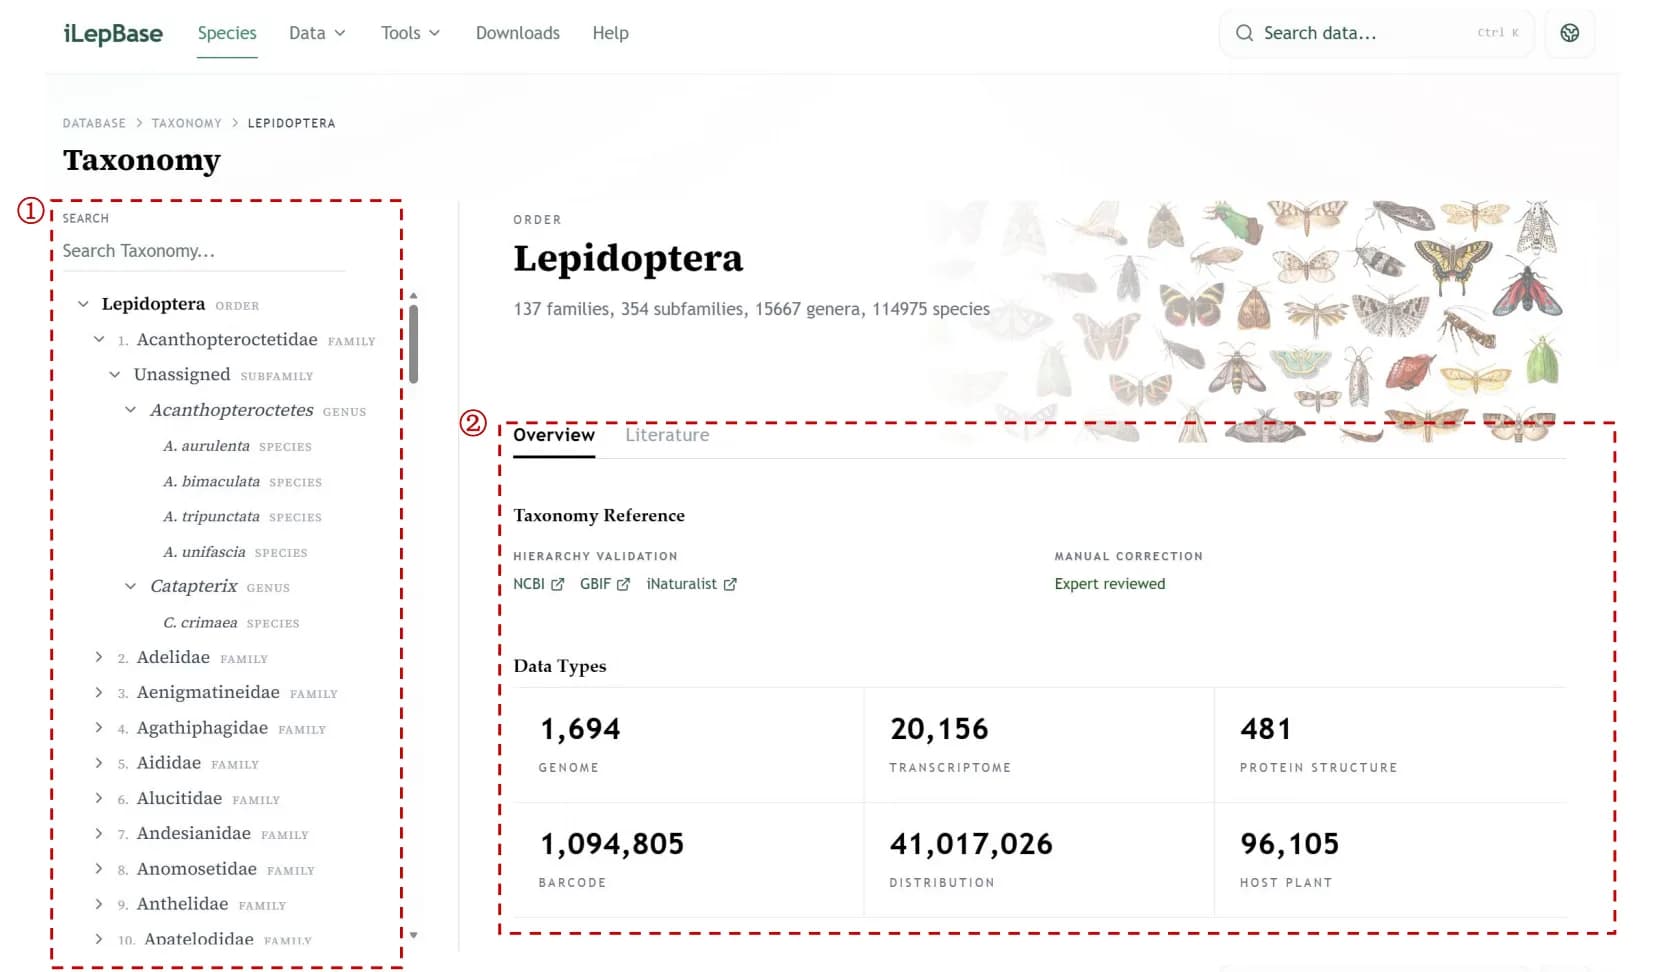
This module integrates taxonomic information for 114,975 Lepidoptera insects from 137 families, 354 subfamilies and 15,667 genera. Users can select species by taxonomic classification and retrieve associated data.
- Browse and search database species with the phylogenetic tree and search bar.
- Click "Overview" to view a target species overview, including classification source and links to related data types.
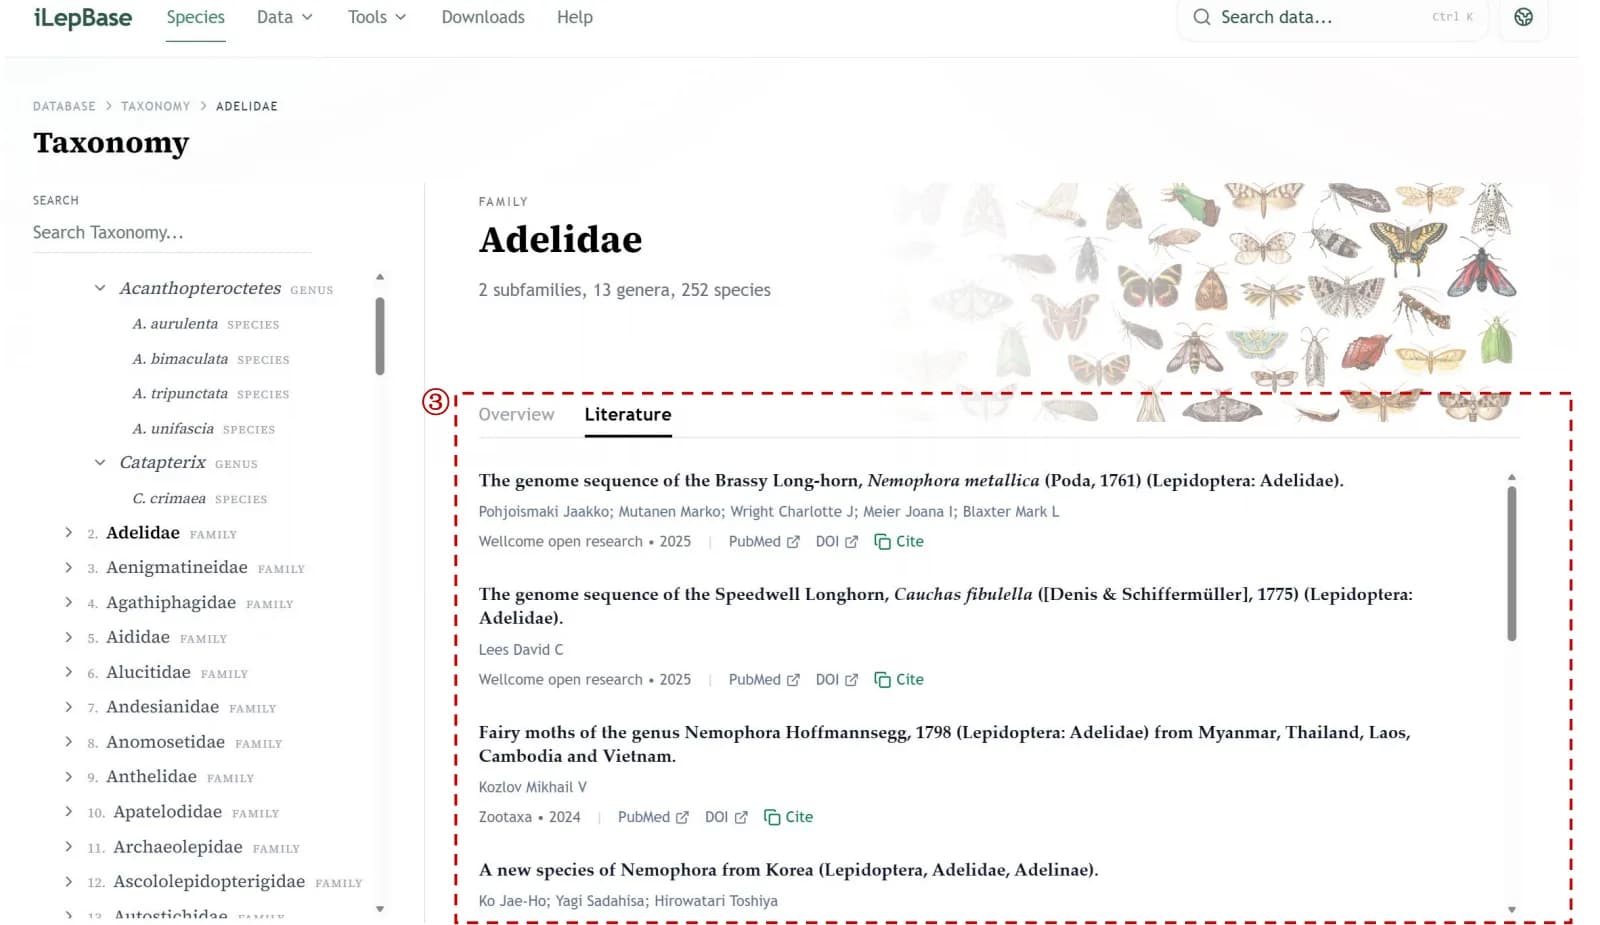
- Click "Literature" to view literature related to the target species.
2.2Genome
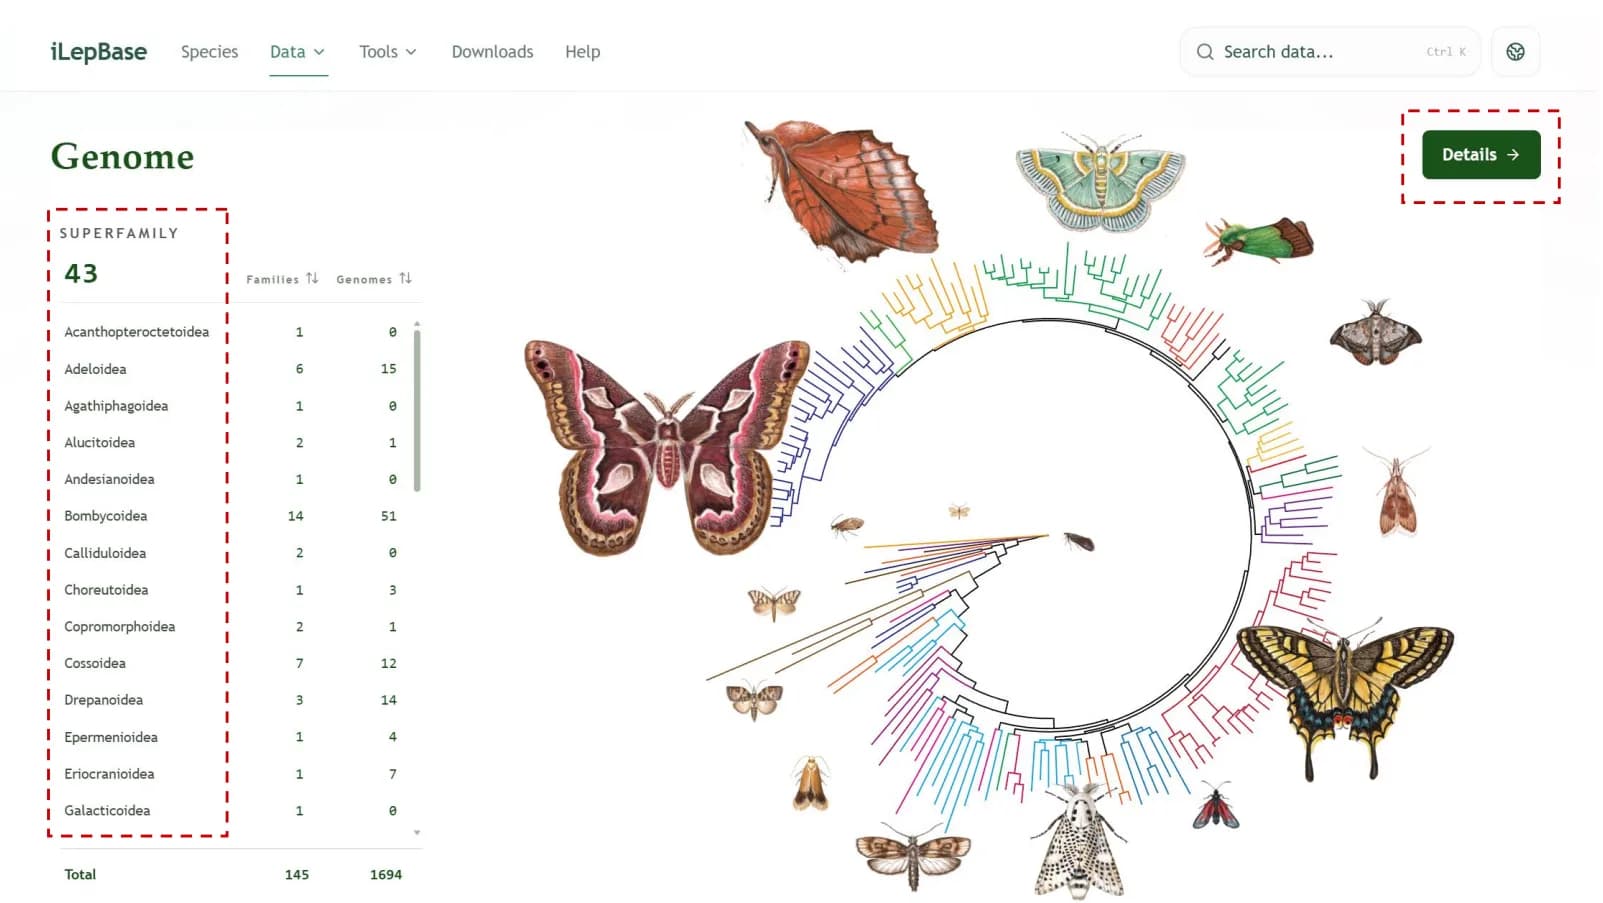
This module integrates genomic information for 1,421 Lepidoptera species spanning all 43 superfamilies and 145 families. It displays evolutionary relationships through a phylogenetic tree, and users can select species based on evolutionary relationships for subsequent genomic research.
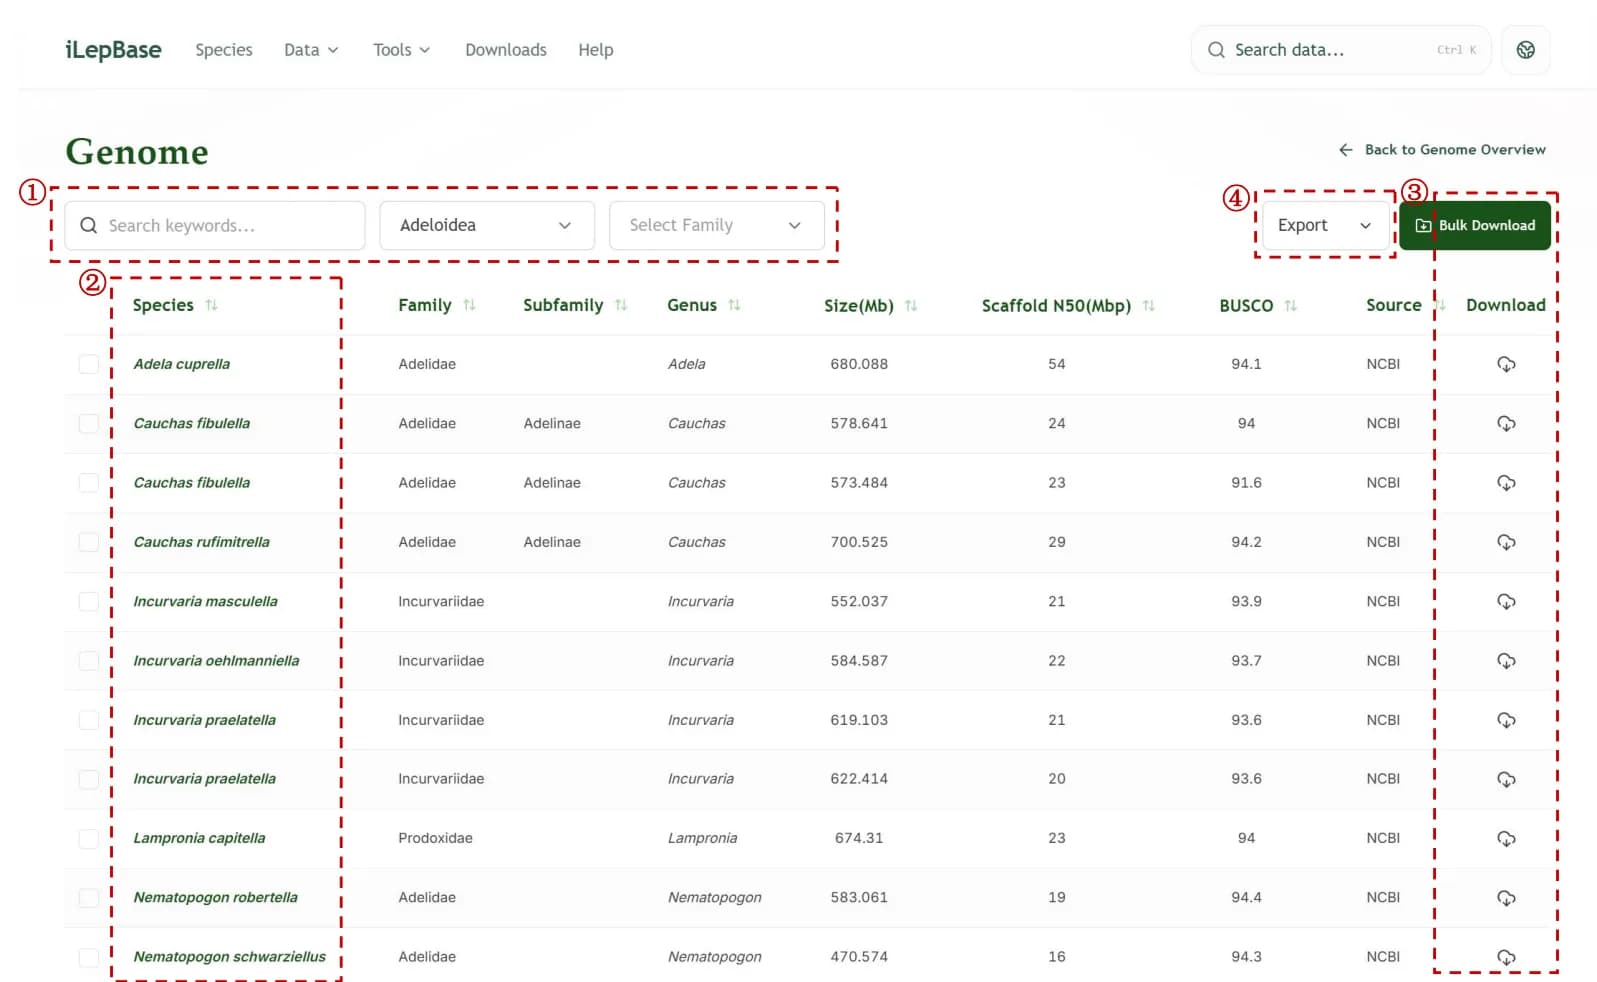
The genome module provides comprehensive access to insect genome assemblies through an intuitive search and filtering interface.
- Quickly filter and search target insect genome data by taxonomic classification, including superfamily and family.
- Click an insect species name to view detailed genomic information.
- Use "Download" or "Bulk Download" to obtain target insect genome data.
- Use "Export" to export tabular data in CSV, Excel or JSON format.
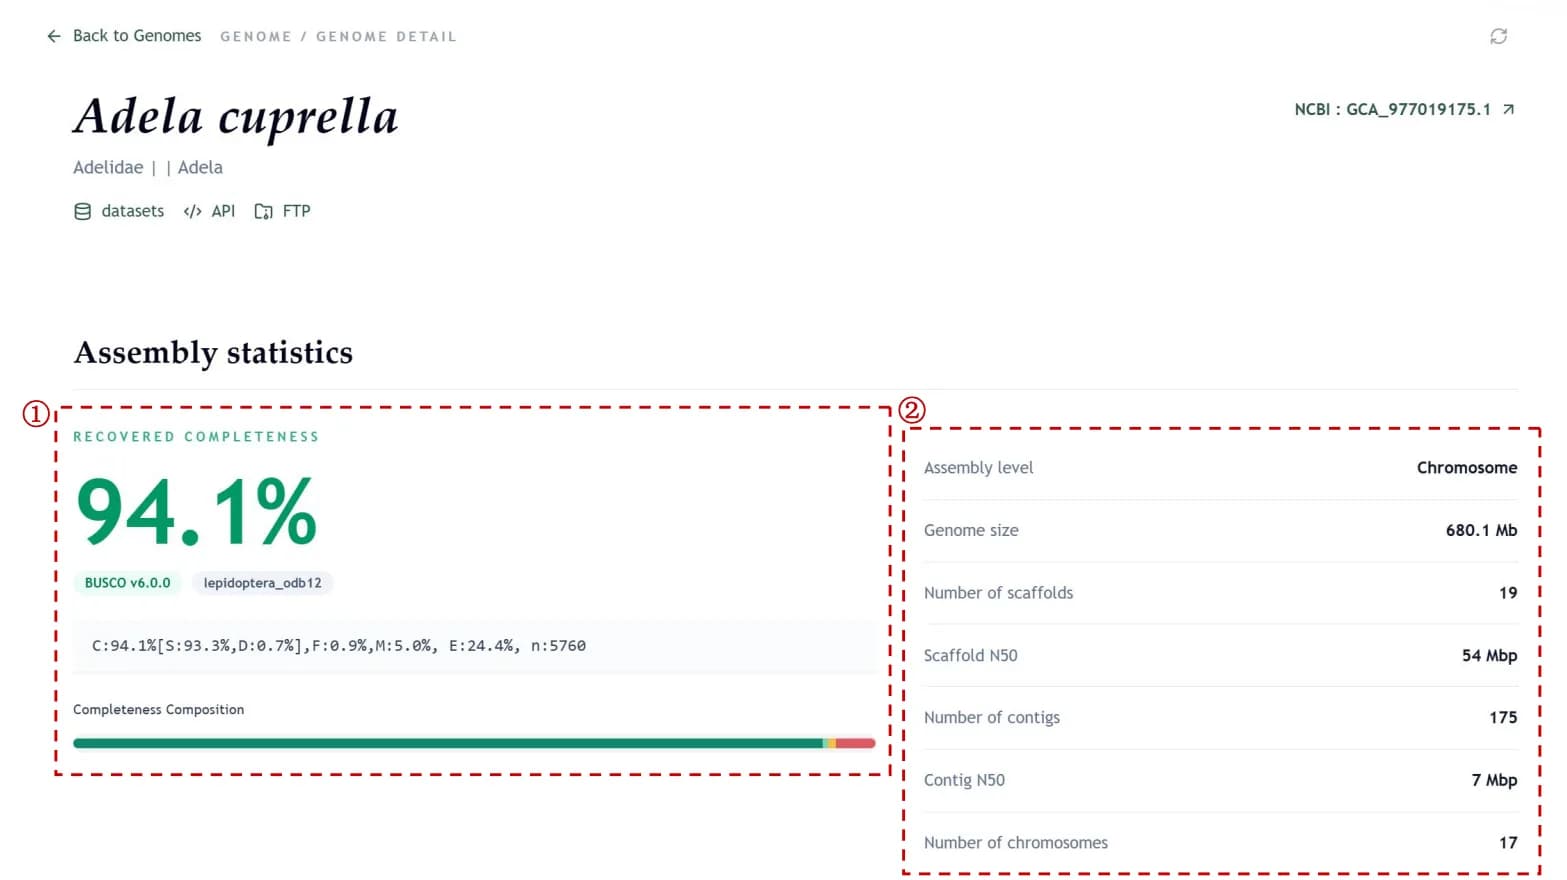
Assembly Statistics
- View assembly completeness evaluation, including proportional data and progress-bar visualization.
- Review assembly level, genome size, scaffold count, scaffold N50, contig count, contig N50 and chromosome count.
Genome Browser
- Browse sequence information for specified genomic regions.
- Query chromosome statistics through a searchable, paginated chromosome information table.
Download
- Click "Download" to download the genome assembly file directly in the browser.
- Click "wget" to copy the command-line download instruction for server or terminal environments.
2.3Transcriptome
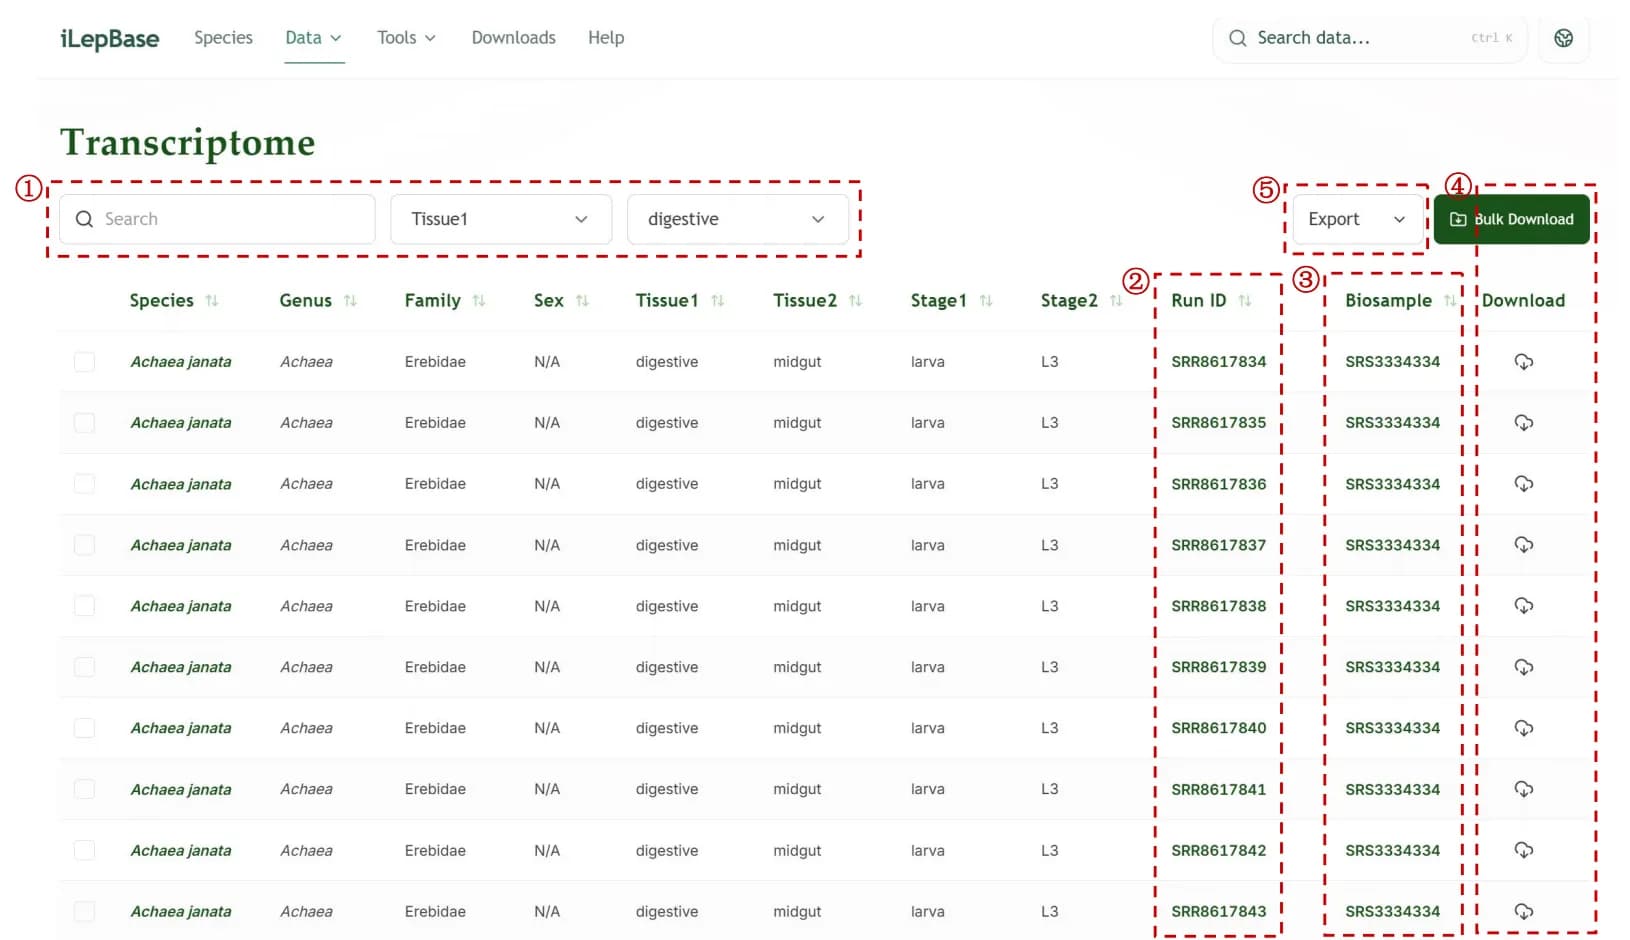
This module integrates transcriptomic information from 20,156 lepidopteran insect samples, providing comprehensive access to insect transcriptome sequencing data.
- Filter and search target transcriptome data by family, genus, sex, tissue and stage.
- Click the Run ID to open the complete sequencing project in NCBI SRA.
- Click the BioSample ID to open the corresponding NCBI BioSample record.
- Use "Download" or "Bulk Download" to download target transcriptome data.
- Use "Export" to export tabular data in CSV, Excel or JSON format.
2.4Protein Structure
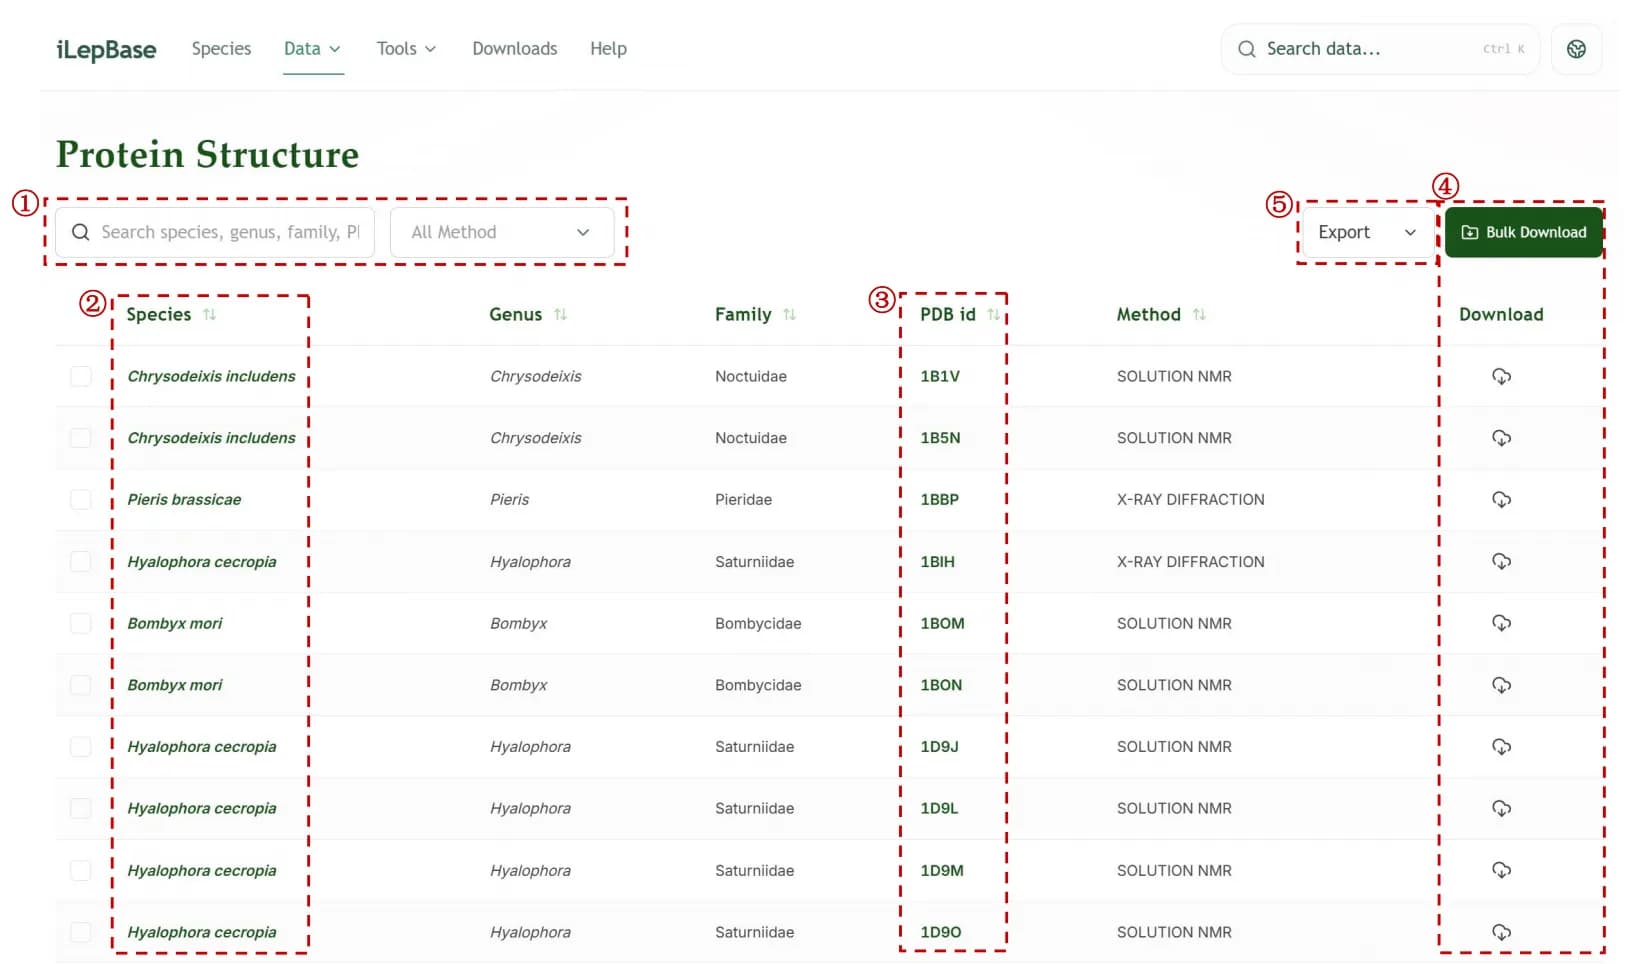
This module integrates 481 experimentally determined and predicted protein structures of lepidopteran insects, providing access to three-dimensional protein structures.
- Filter and search target proteins by structure determination method, including X-RAY DIFFRACTION and SOLUTION NMR.
- Click the insect species name to view detailed protein structure information.
- Click the PDB ID to open the target protein structure in the RCSB PDB database.
- Use "Download" or "Bulk Download" to download target protein structure data.
- Use "Export" to export tabular data in CSV, Excel or JSON format.
Protein Metrics
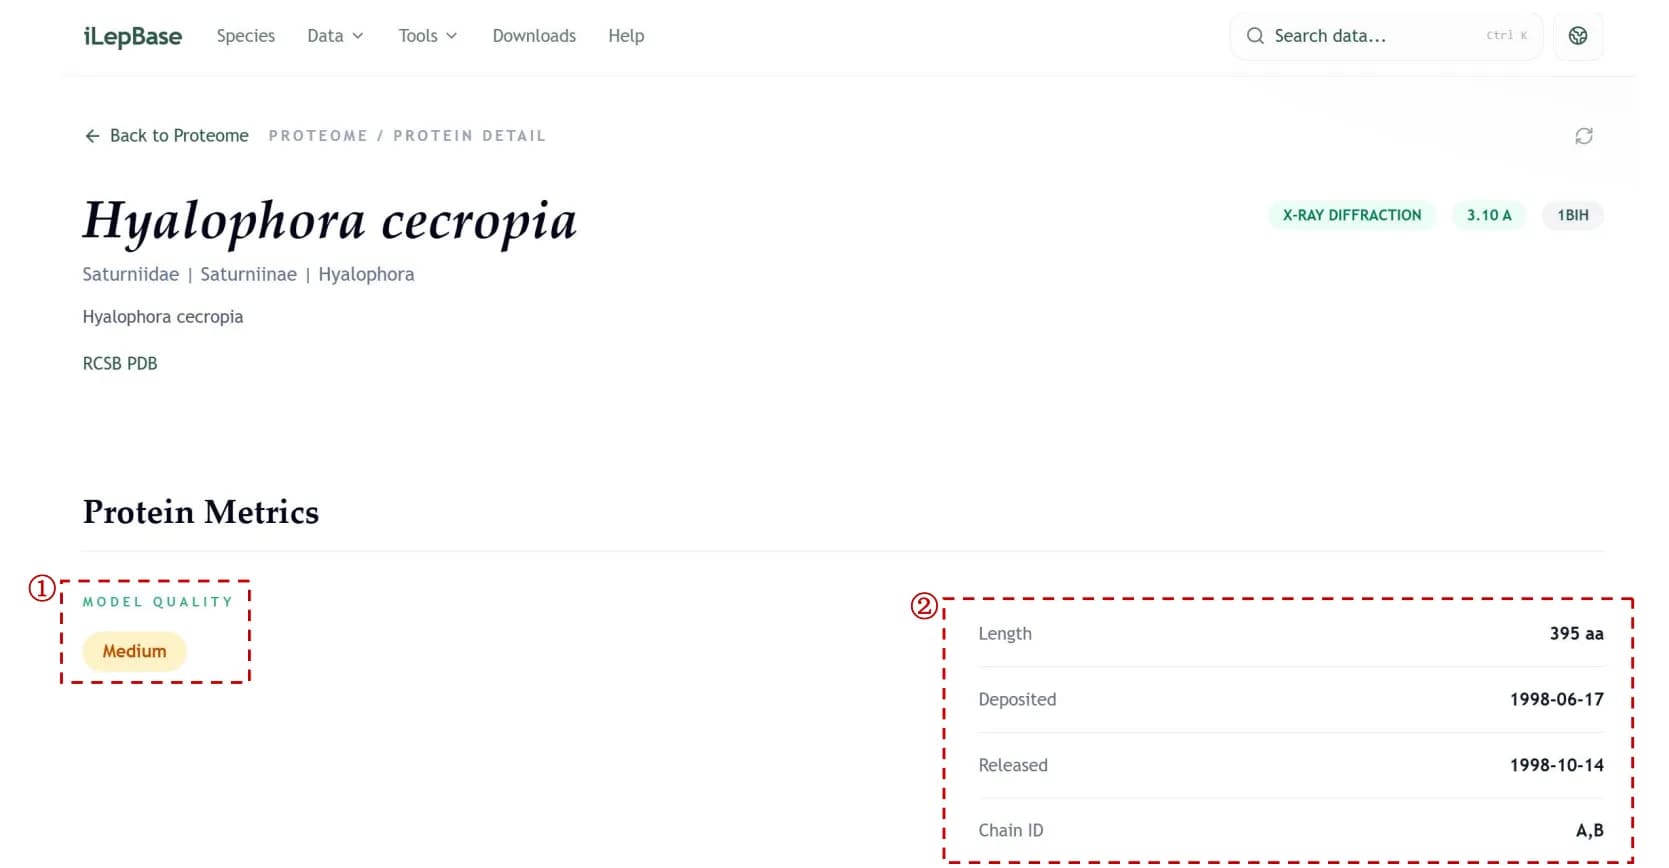
Each protein structure entry provides basic information, protein metrics, an interactive 3D visualization, sequence, source literature and related downloads.
- Review protein structure model quality assessment.
- View protein length, deposit date, release date and chain identifier.
Interactive 3D Viewer
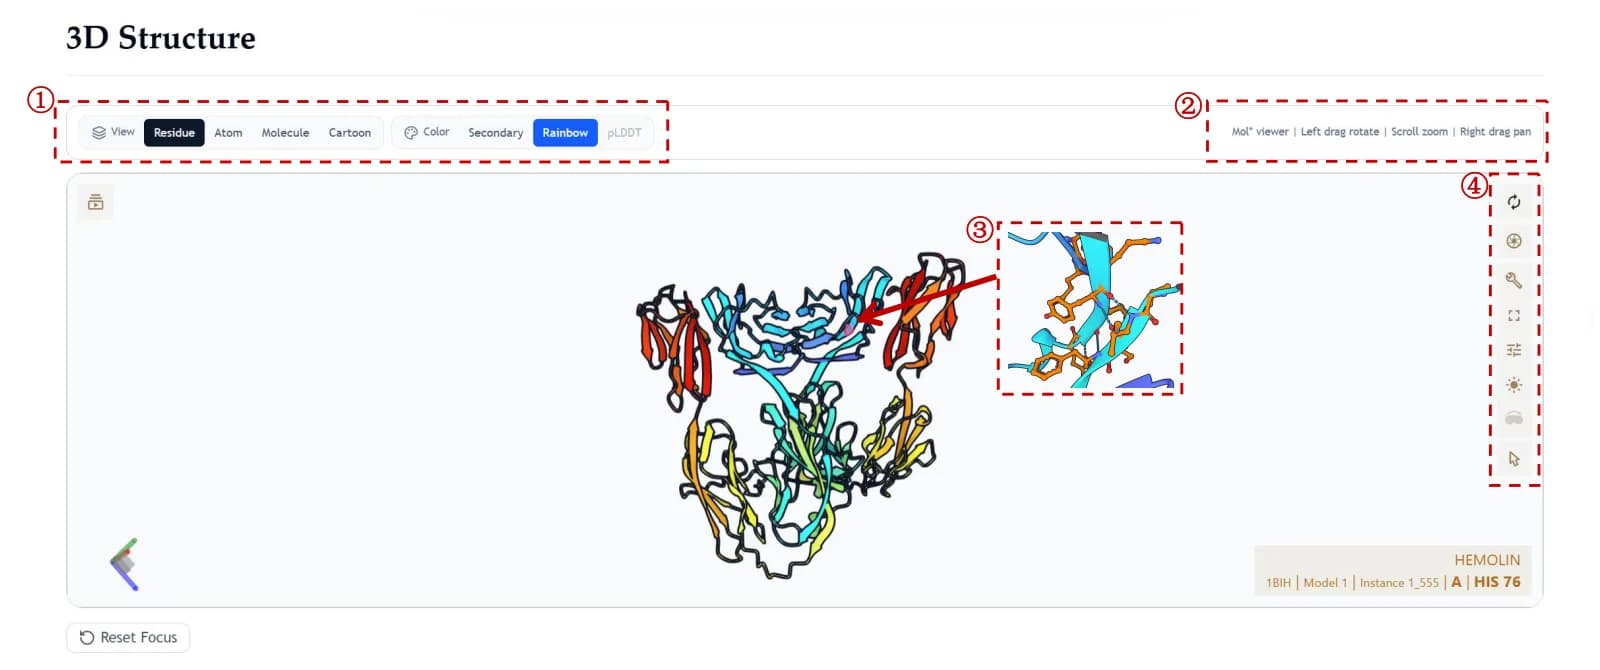
- Switch display modes such as Residue, Atom, Molecule and Cartoon.
- Switch color schemes such as Secondary and Rainbow.
- Rotate, translate, zoom and reset the model to the canvas center.
- Click protein sites to view the ball-and-stick model of the corresponding site.
- Use the right sidebar for more advanced operations.
Sequence, Literature and Downloads
- Inspect the protein amino acid sequence.
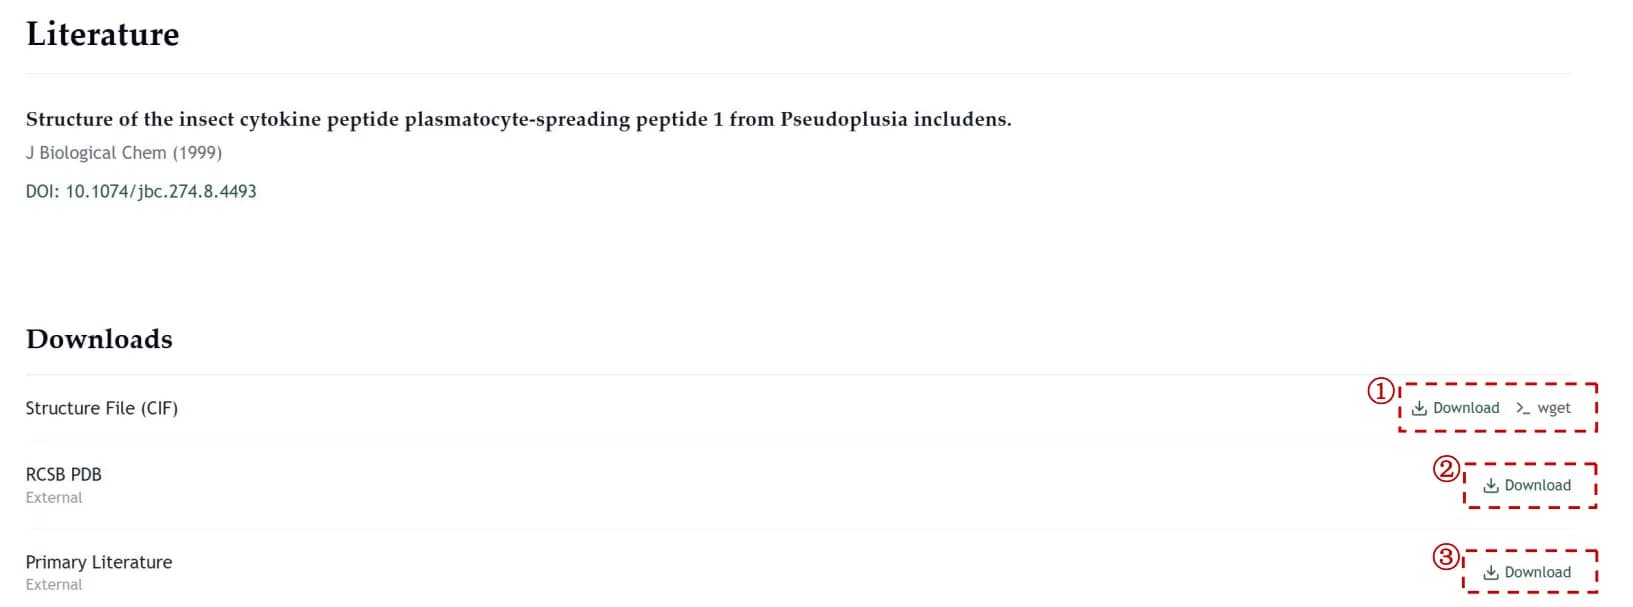
- Download protein structure files in CIF format through browser links or wget commands.
- Download resources from the external RCSB PDB database.
- Download the primary research literature when available.
2.5Barcode
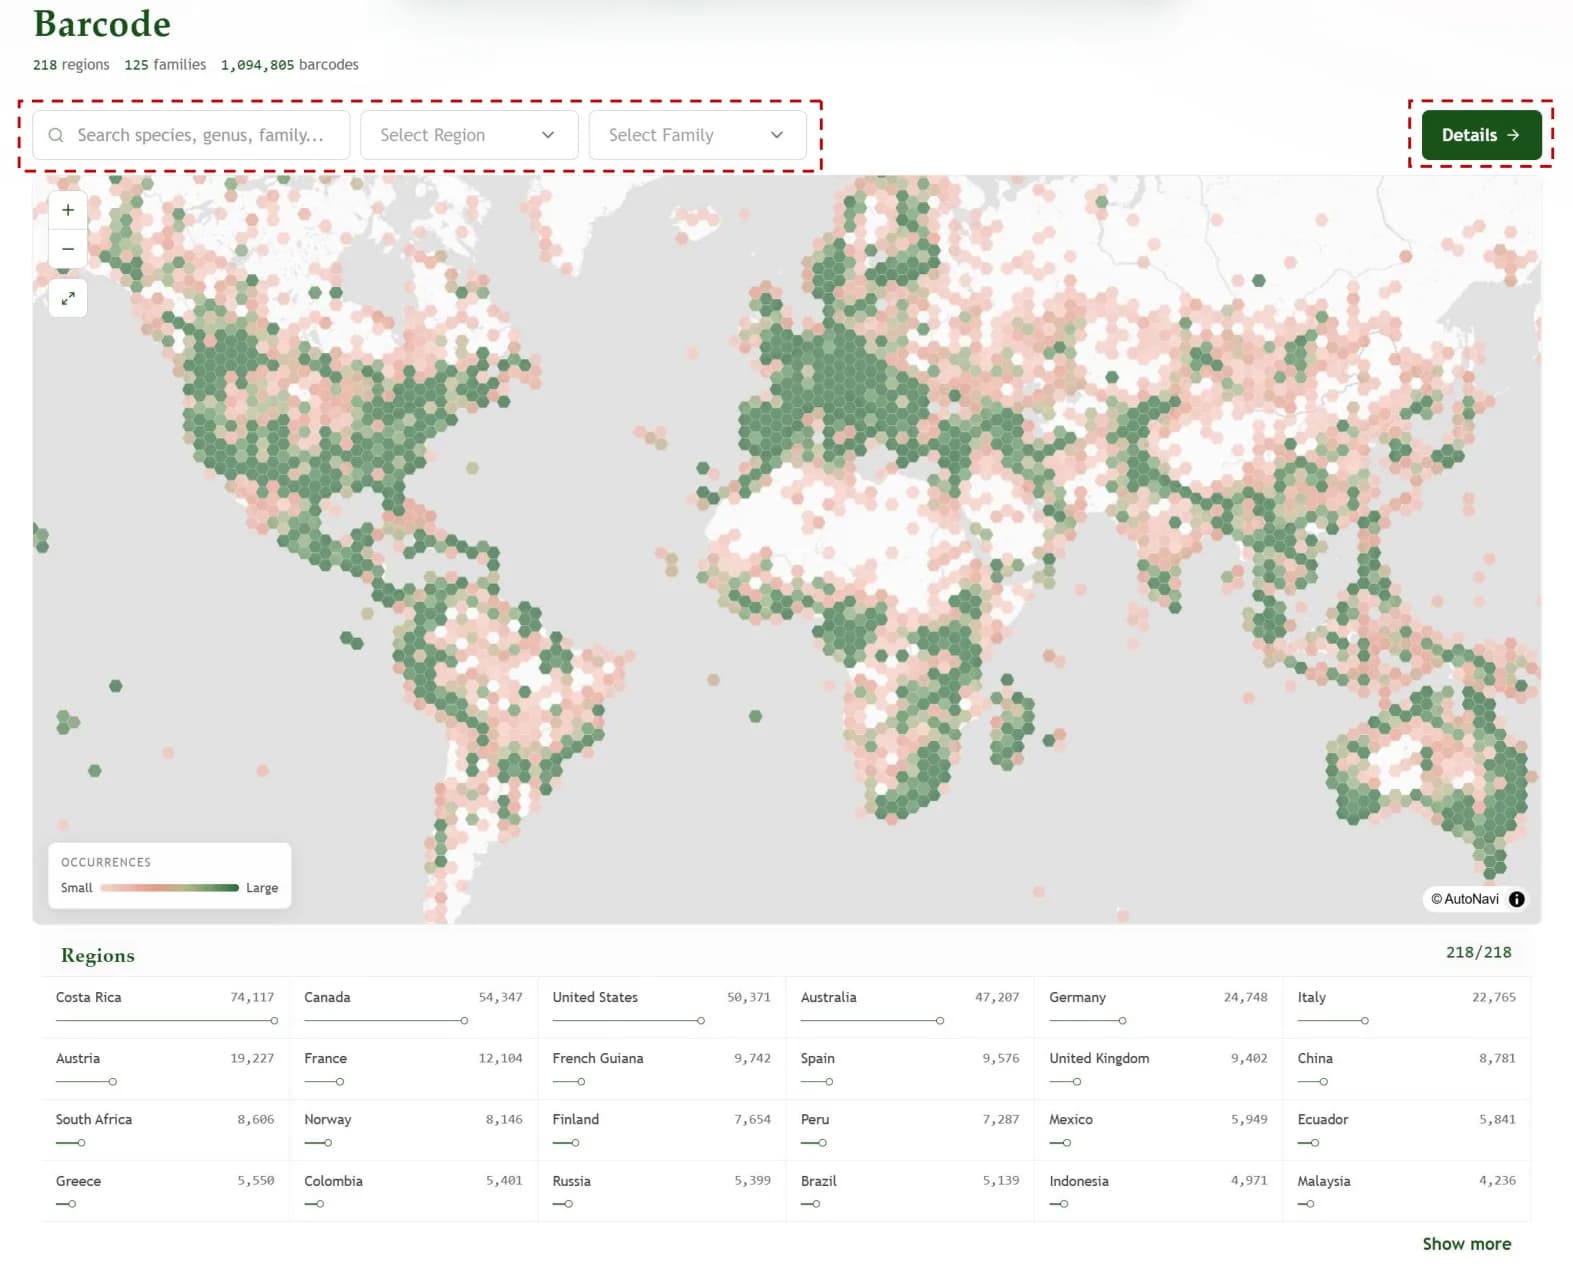
This module integrates barcode information for 1,094,805 Lepidoptera insects across 218 regions and 125 families. It presents geographic barcode distribution through a world-map heatmap, where darker colors indicate more barcode records in a region.
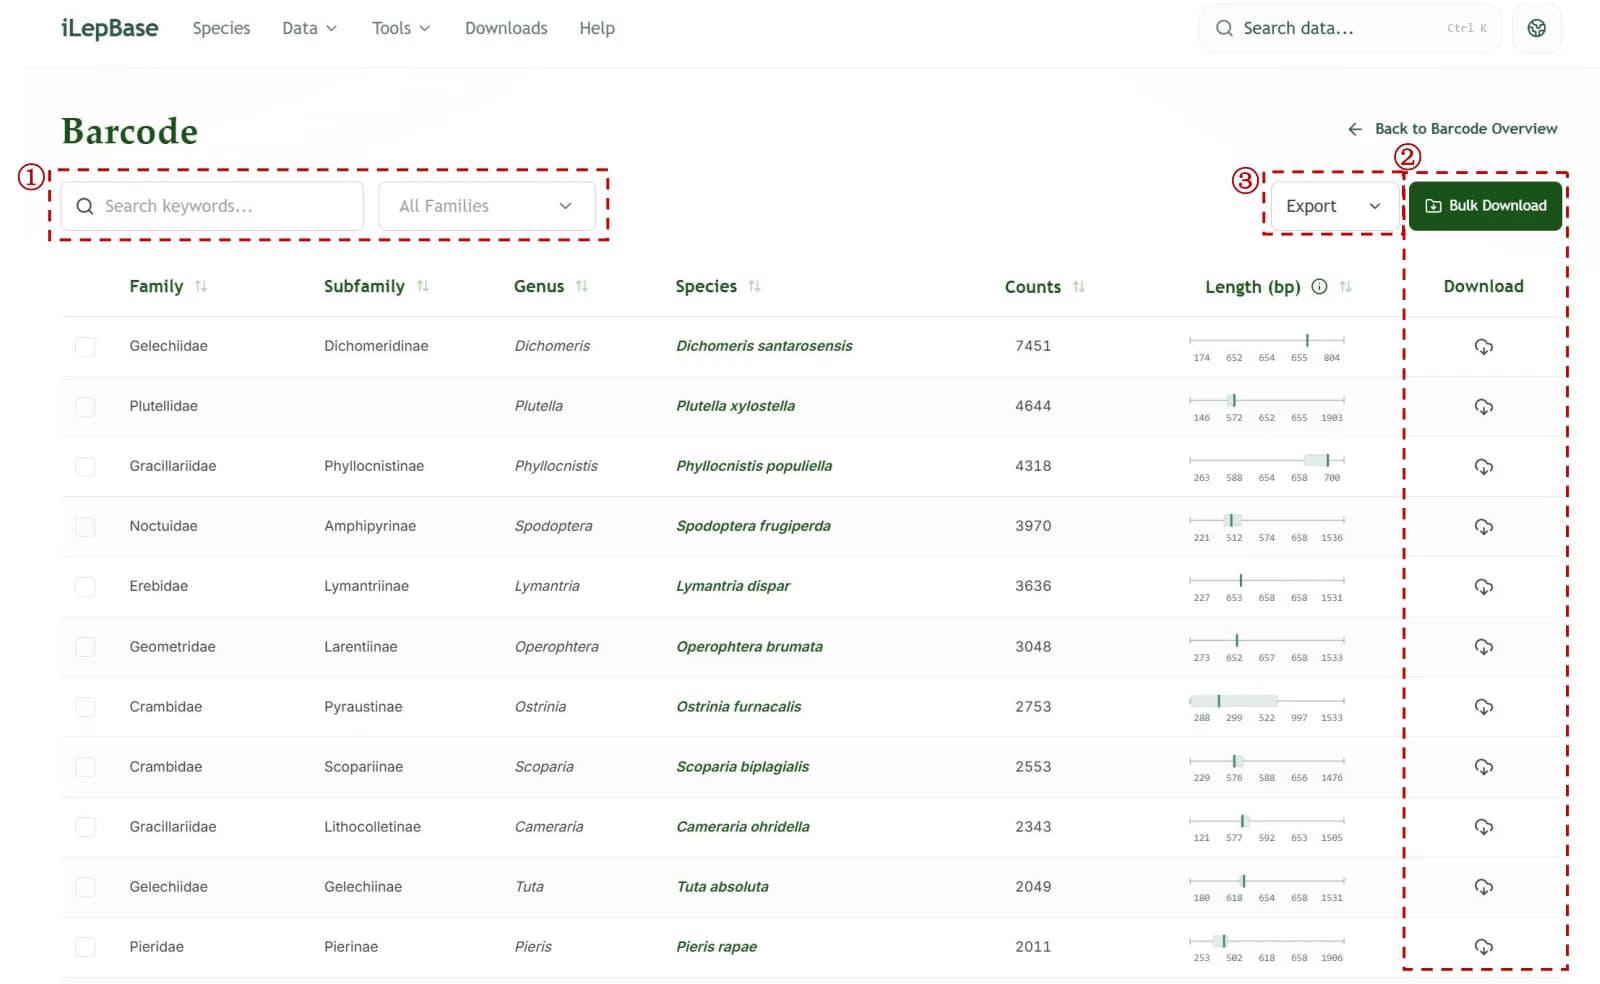
The barcode module also provides DNA barcode data downloads through an intuitive search and filtering interface.
- Filter and search target insects by taxonomic classification, including family.
- Use "Download" or "Bulk Download" to download DNA barcode data.
- Use "Export" to export tabular data in CSV, Excel or JSON format.
2.6Distribution
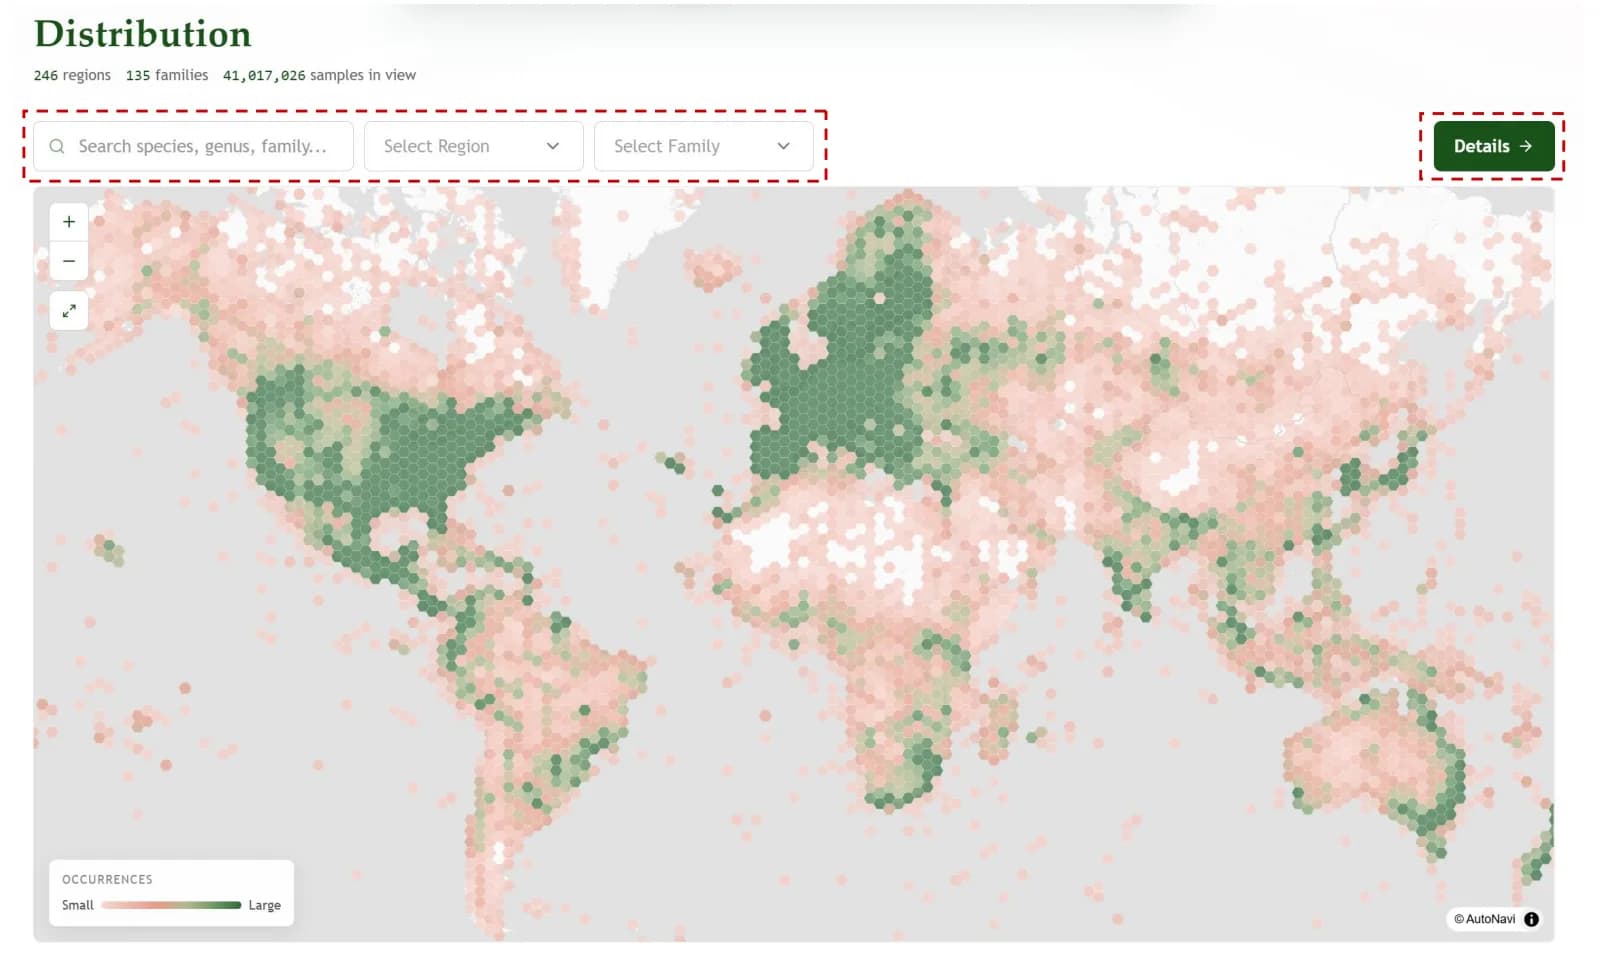
This module integrates location information for 41,017,026 Lepidoptera insect samples from 135 families in 246 regions. It displays sample geography as a world-map heatmap, where darker colors indicate larger numbers of records.
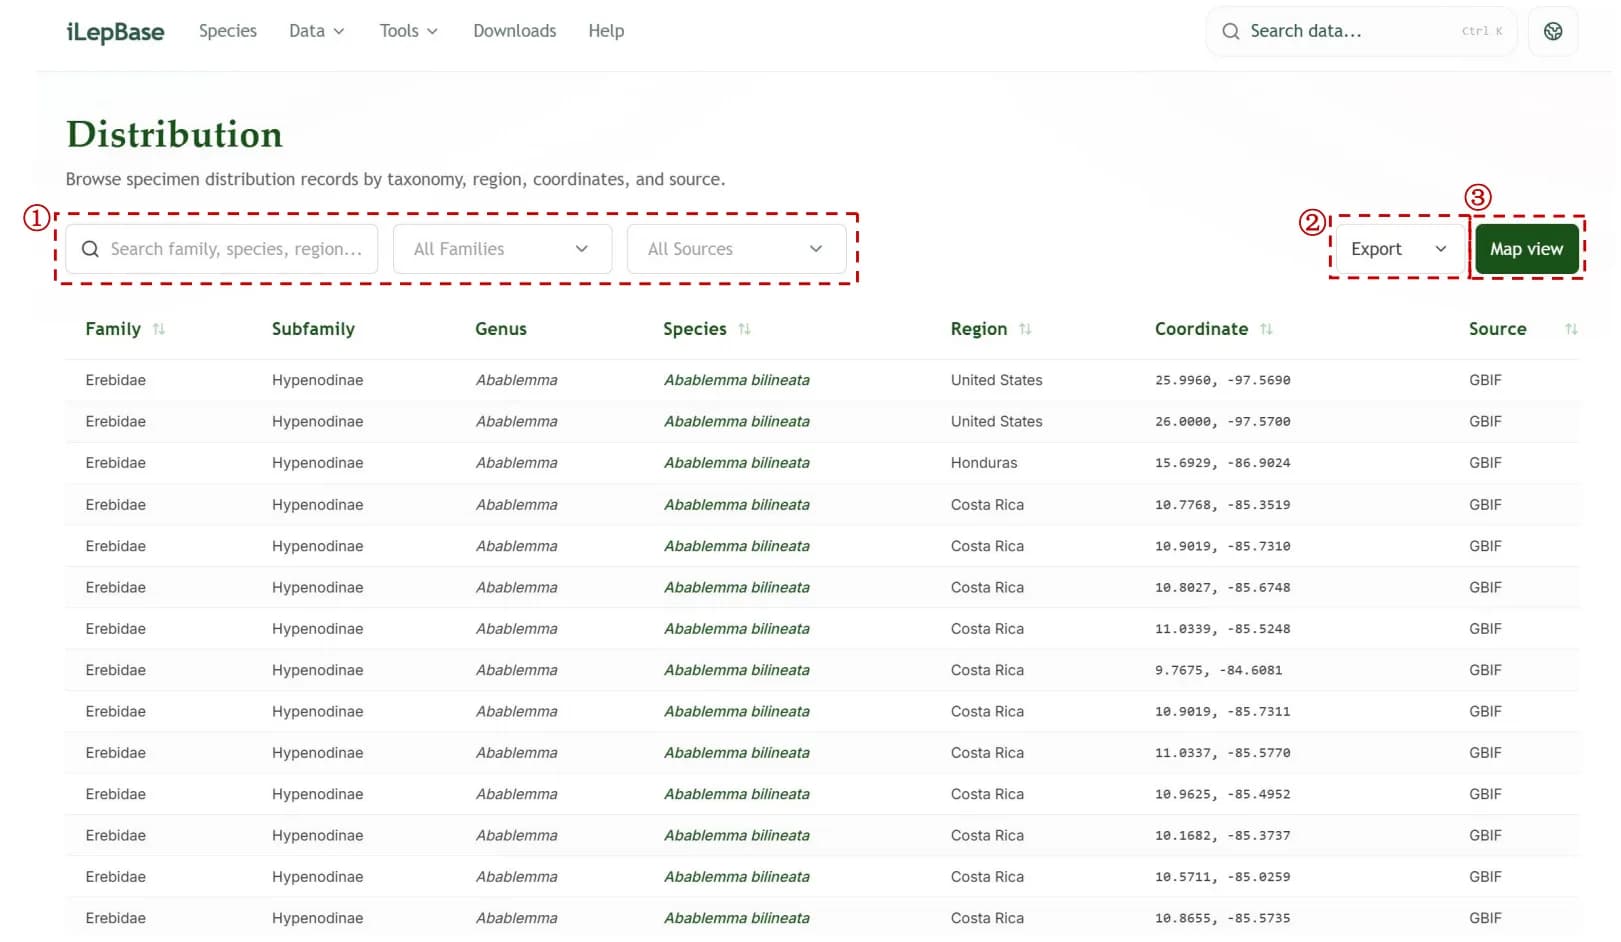
The Distribution module provides comprehensive access to geographic distribution information through search, filtering, table export and map exploration.
- Filter and search target insects by family and data source, including BOLD and GBIF.
- Use "Export" to export tabular data in CSV, Excel or JSON format.
- Click "Map view" to switch to map view and inspect target insect locations visually.
2.7Host Plant
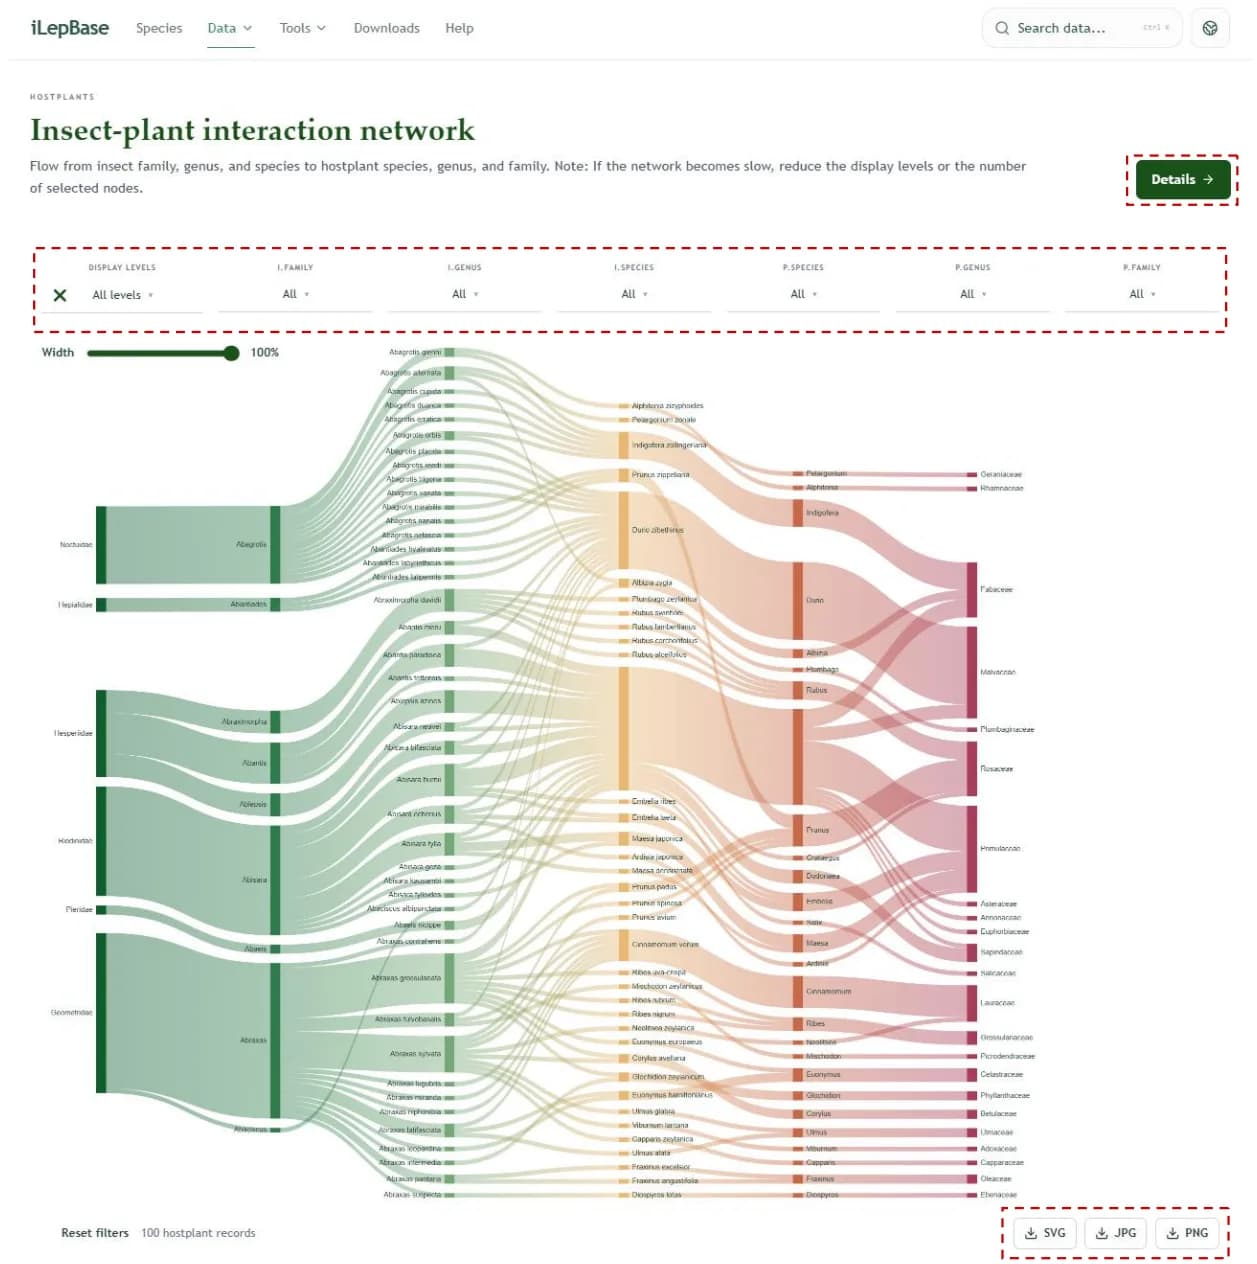
This module integrates interaction information between Lepidoptera insects and their host plants. It displays insect-plant relationships through a Sankey diagram, where flows move from insects on the left to host plants on the right.
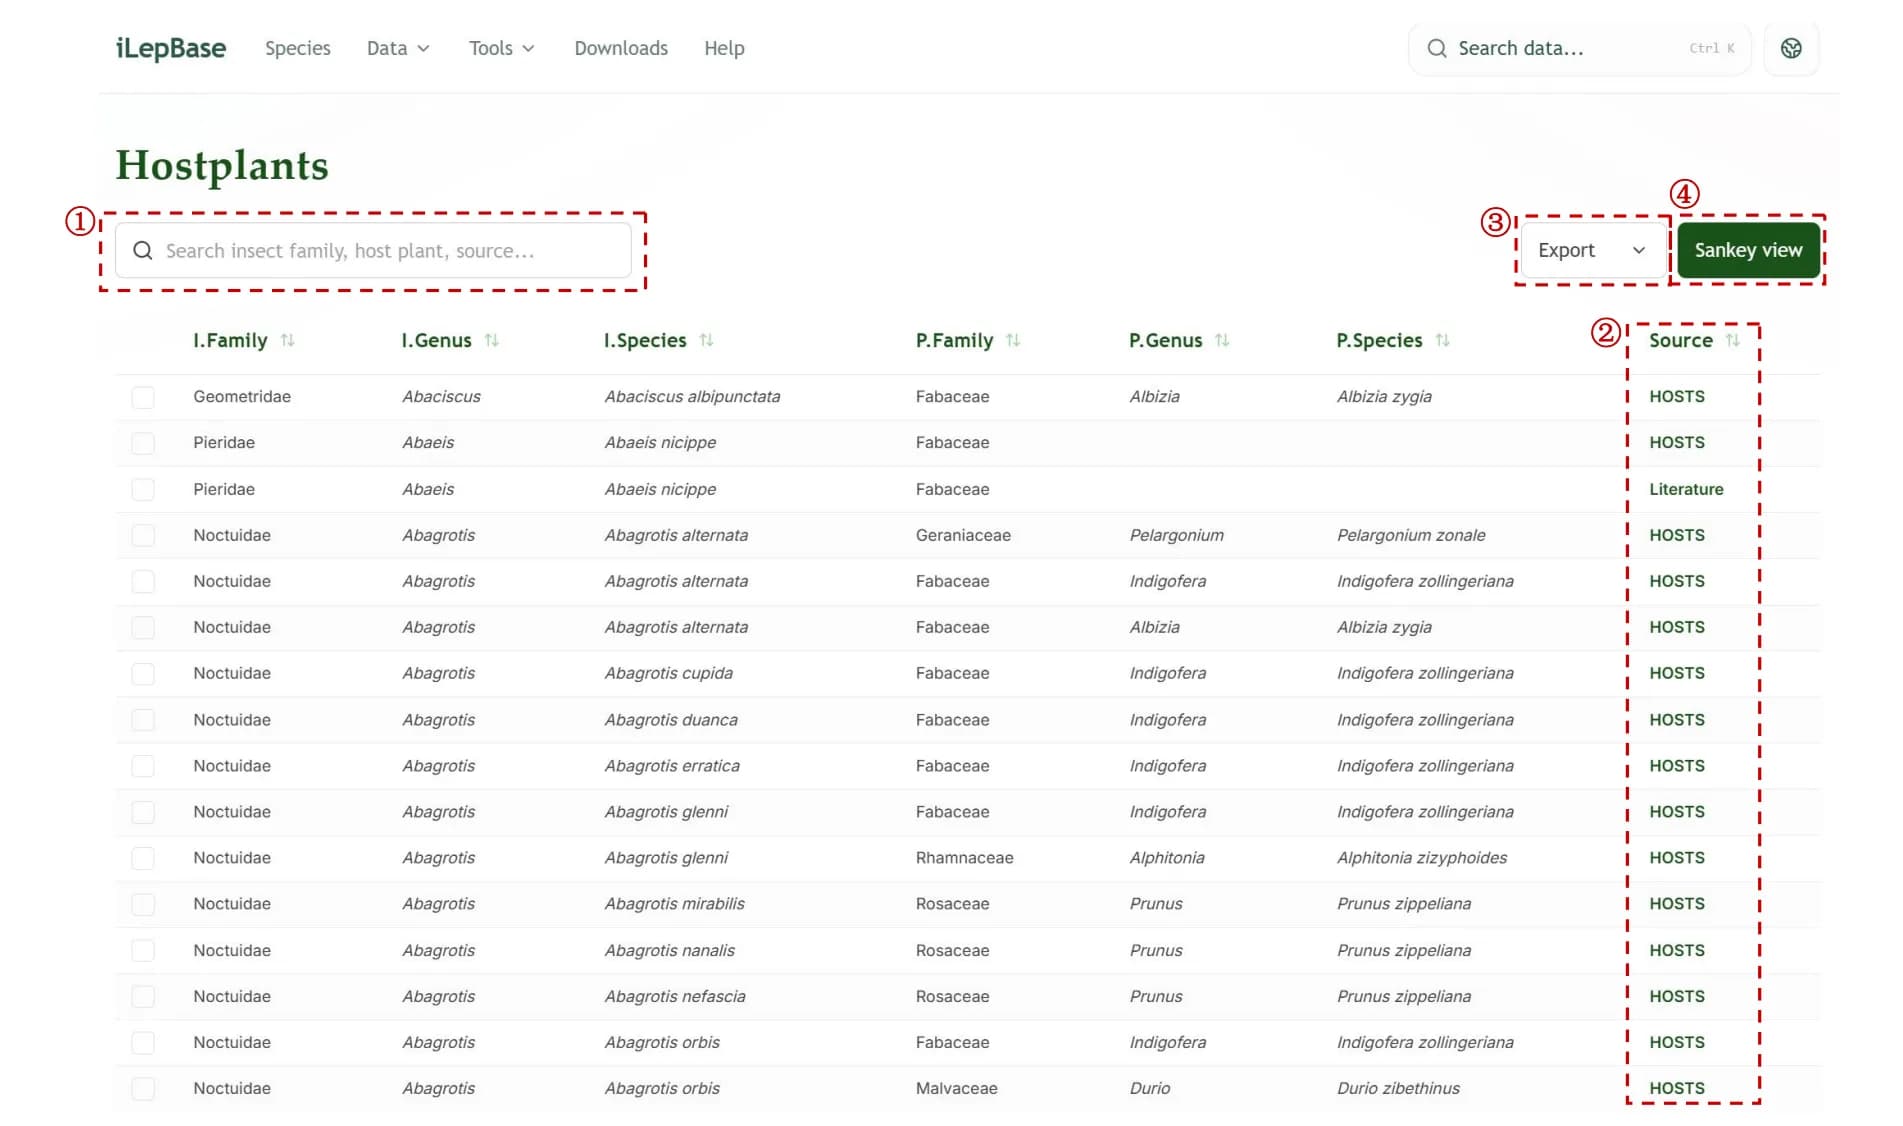
The Host Plant module provides comprehensive access to insect-host plant interaction relationships through an intuitive search interface.
- Search target interaction relationships by insect family, host plant and data source.
- Click "Source" to view the reference origin of an interaction record.
- Use "Export" to export tabular data in CSV, Excel or JSON format.
- Click "Sankey View" to switch to the Sankey diagram for visual exploration of interaction relationships.
2.8Literature
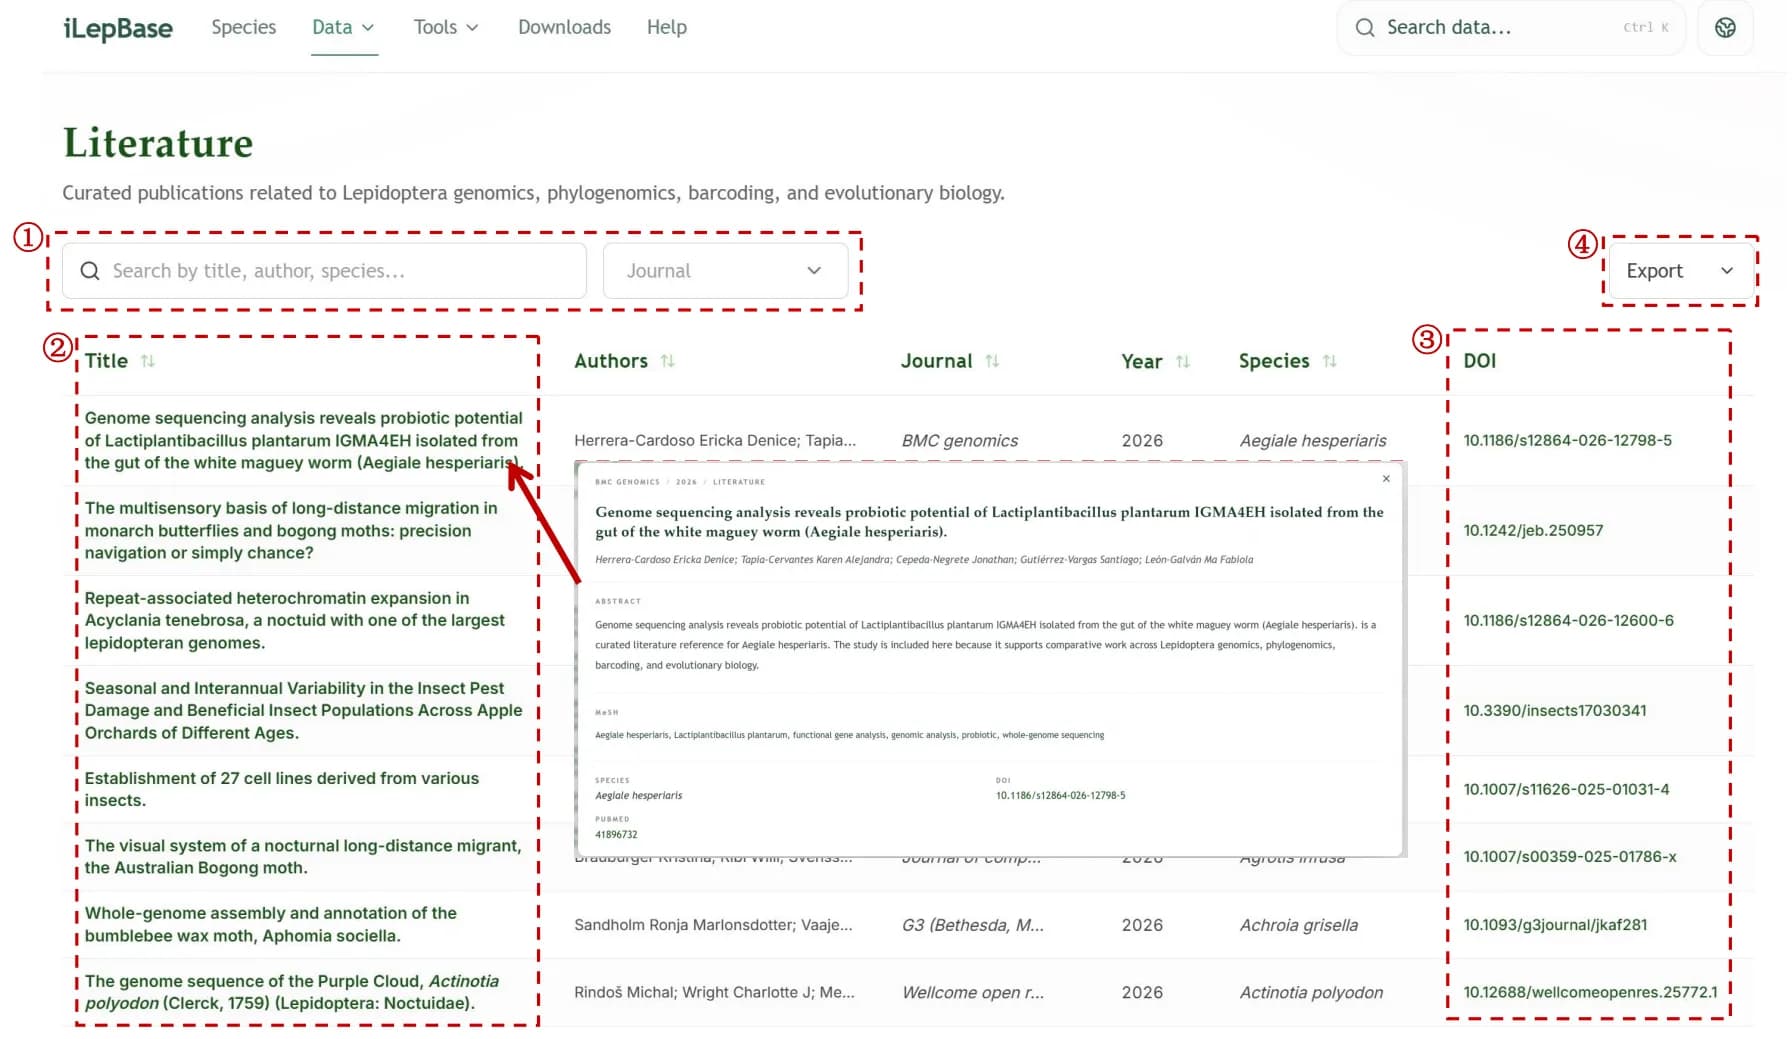
This module integrates curated publications related to lepidopteran genomics, phylogenomics, DNA barcoding and evolutionary biology. Users can filter, search and access detailed information by journal classification.
- Filter and search target publications by journal classification.
- Click an article title to view source, title, abstract and annotated details.
- Click the article "DOI" to access the full article content.
- Use "Export" to export tabular data in CSV, Excel or JSON format.
3Tools
Five online analysis tools are provided.
3.1Blast
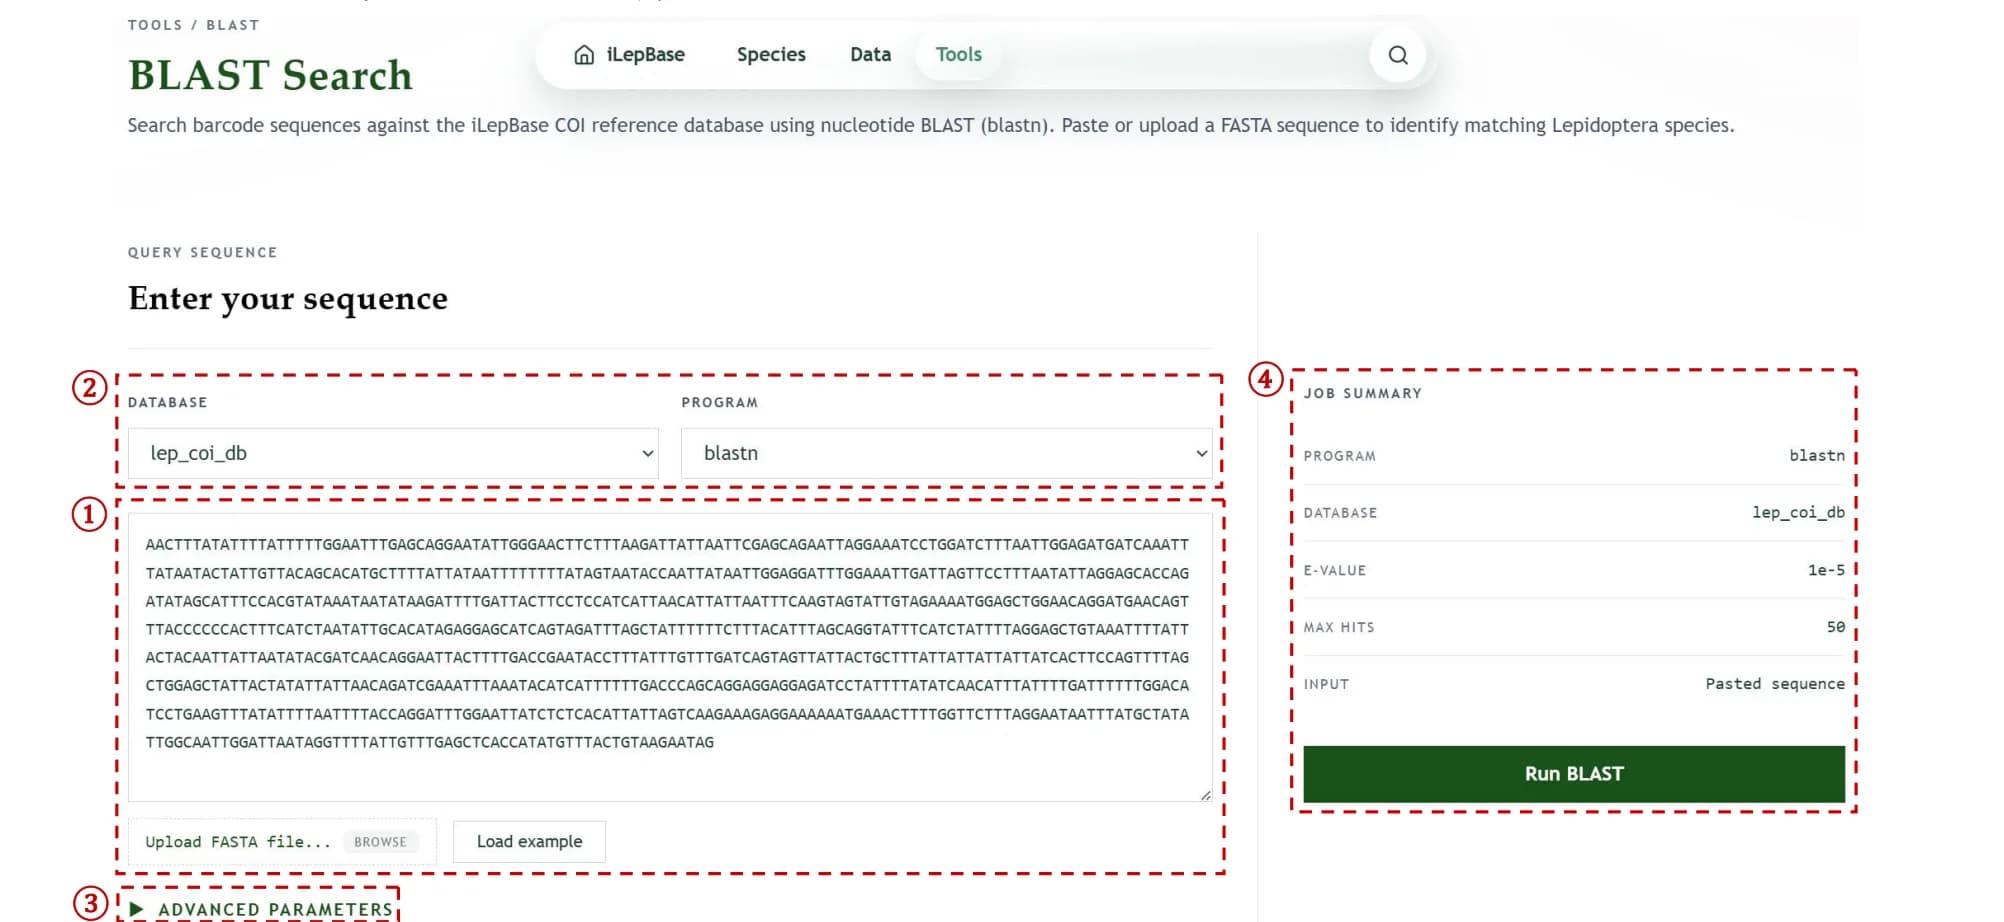
This tool compares a barcode sequence entered by the user with the iLepBase COI reference database, helping identify potentially matching Lepidoptera species. Users can paste or upload FASTA sequences for analysis.
- Enter the query sequence in the text box or upload a local FASTA file.
- Select the database and BLAST program, including lep_coi_db, lep_protein_db, blastn, blastp and blastx.
- Expand Advanced Parameters to set the comparison options.
- Review the Job Summary and click Run BLAST to start the analysis.
- Inspect the BLAST results displayed below the page after the run finishes.
3.2JBrowse
This tool is used to interactively browse genome assembly results of Lepidoptera species. Users can select a preset genome dataset or enter a chromosome or genomic region to view reference sequences, gene annotations and variant sites.
- Select the species and genome assembly to browse by species, assembly name or genome search.
- Choose an available genome entry, such as Danaus plexippus Chr 2 or Abraxas grossulariata OZ319744.1.
- Enter a Location to jump to a specified genomic region.
- Review common tracks such as reference sequence, gene models and allele panel.
- Select an assembly, click OPEN, or show all regions in the selected assembly.
3.3Mol* Viewer
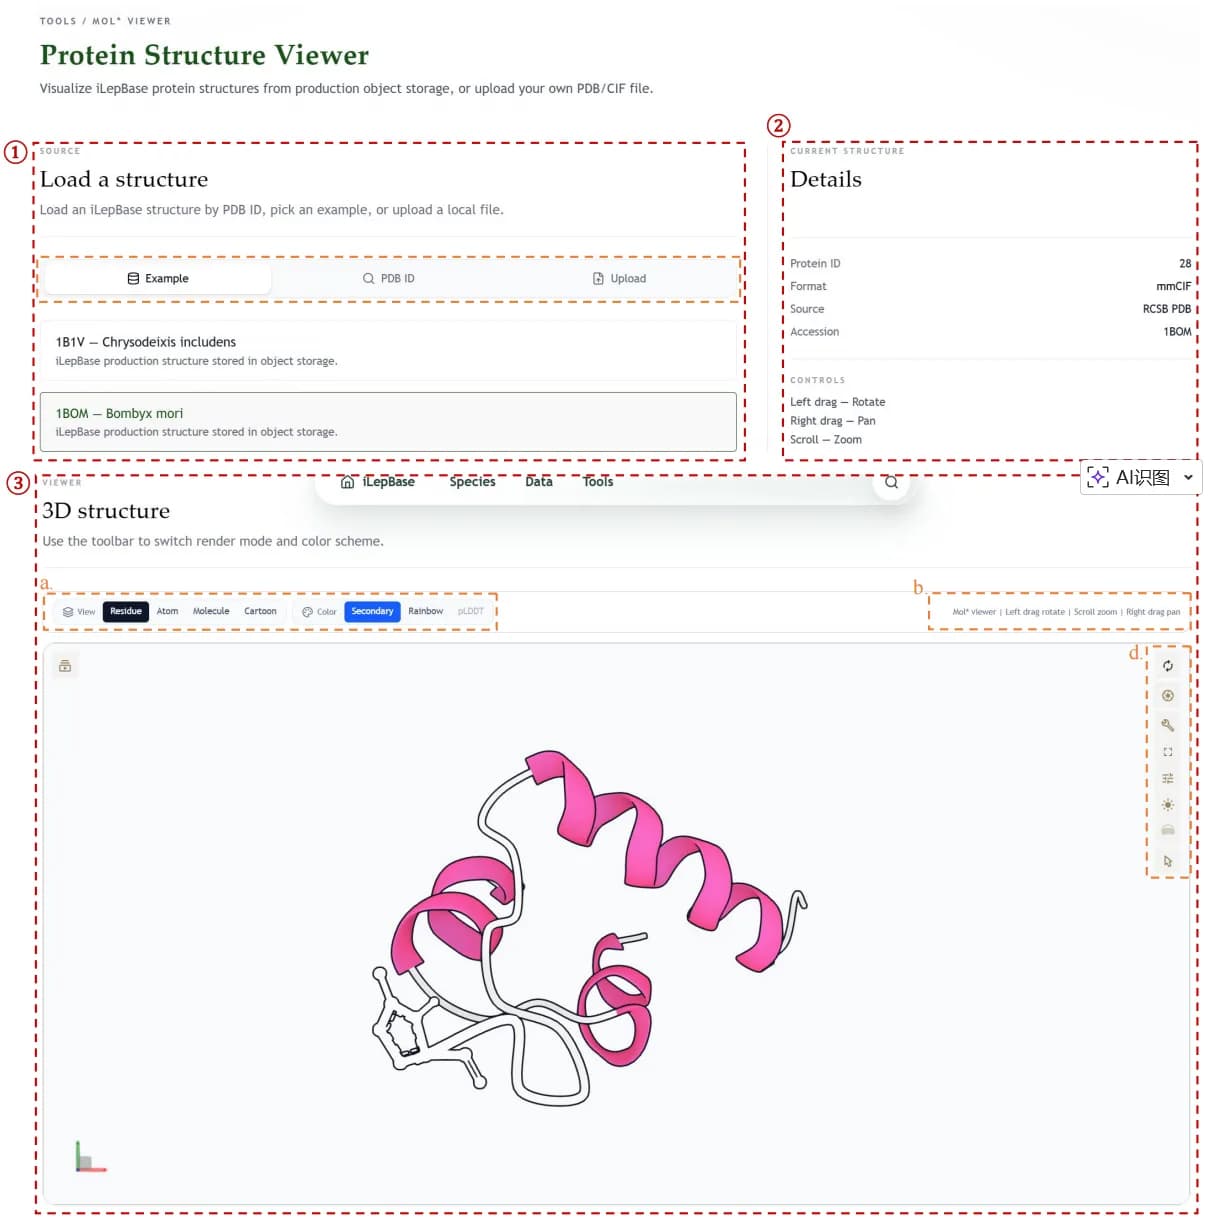
This tool is used to view and interactively browse protein three-dimensional structures online. Users can select configured example structures or upload PDB/CIF files for visualization analysis.
- Load a structure from examples, by PDB ID, or by uploading a .pdb/.cif file.
- Review current structure details including protein ID, format and source.
- Switch modes such as Residue, Atom, Molecule and Cartoon.
- Switch colors such as Secondary and Rainbow, then rotate, translate, zoom or reset the structure view.
3.4MMNet
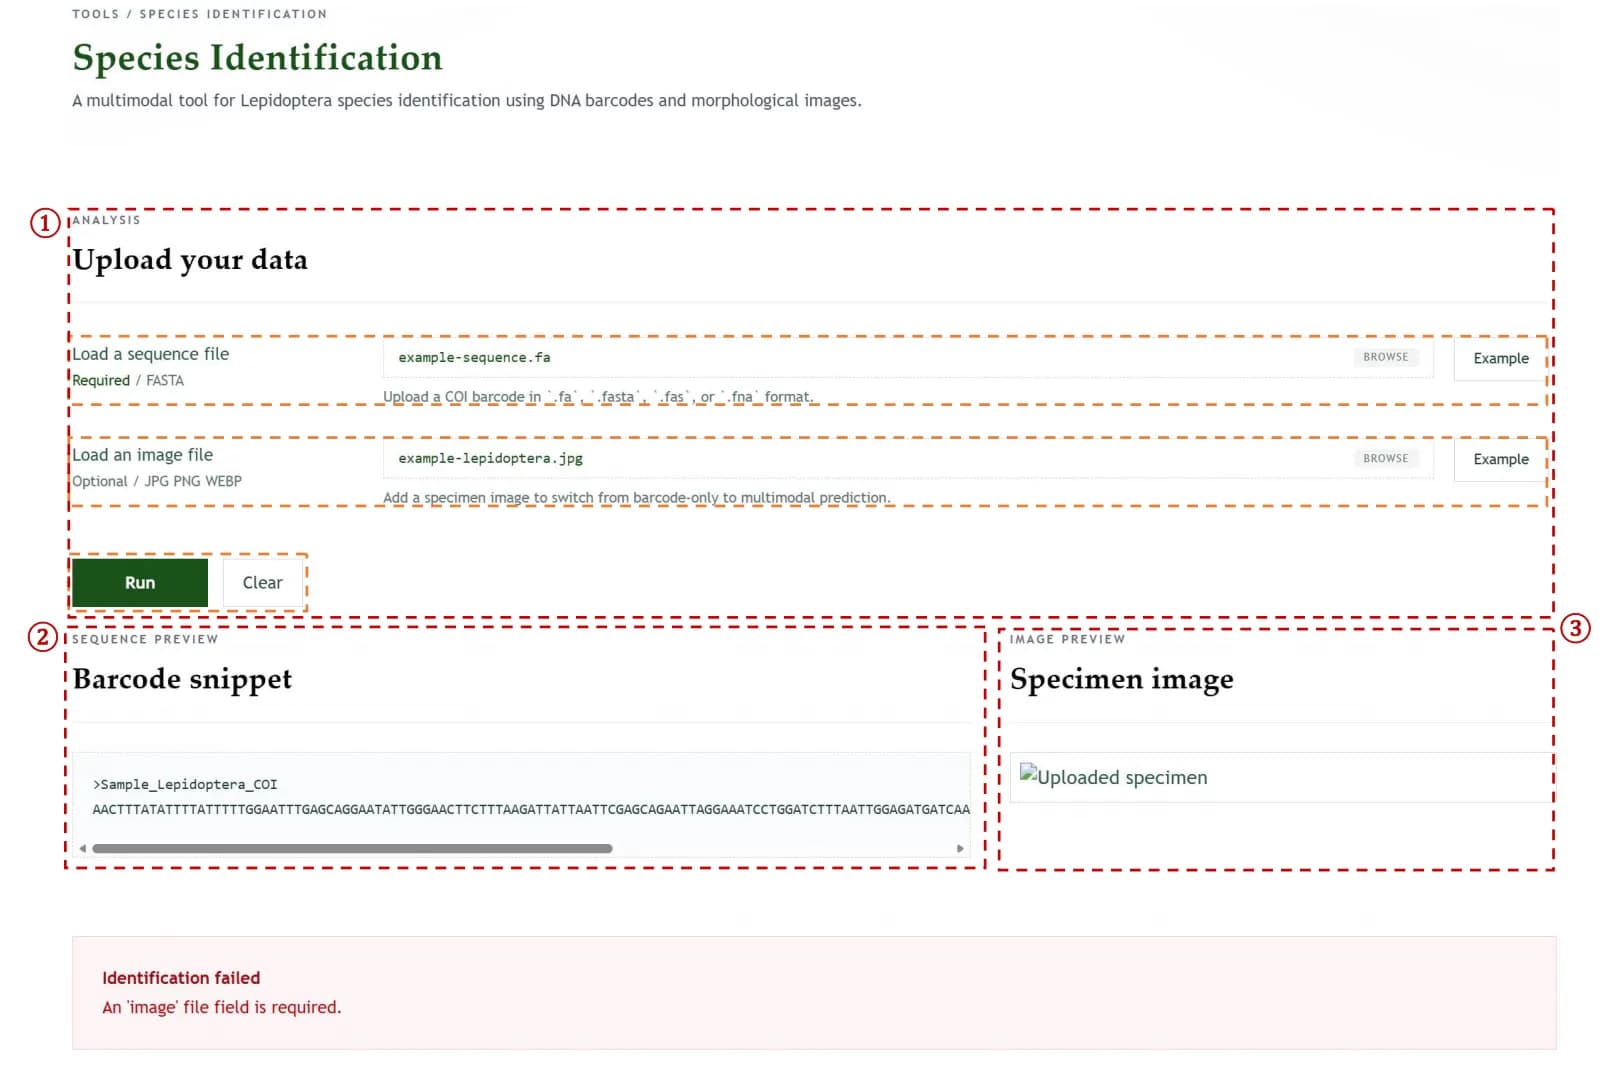
This tool is used for multimodal Lepidoptera species identification. It can identify species from DNA barcode sequences and can combine morphological images for multimodal prediction.
- Upload a sequence file in FASTA format.
- Upload an image file in JPG, PNG or WEBP format.
- Click Run for analysis.
- Review the sequence in Barcode snippet and the image in Specimen image.
3.5NicheBarcoding
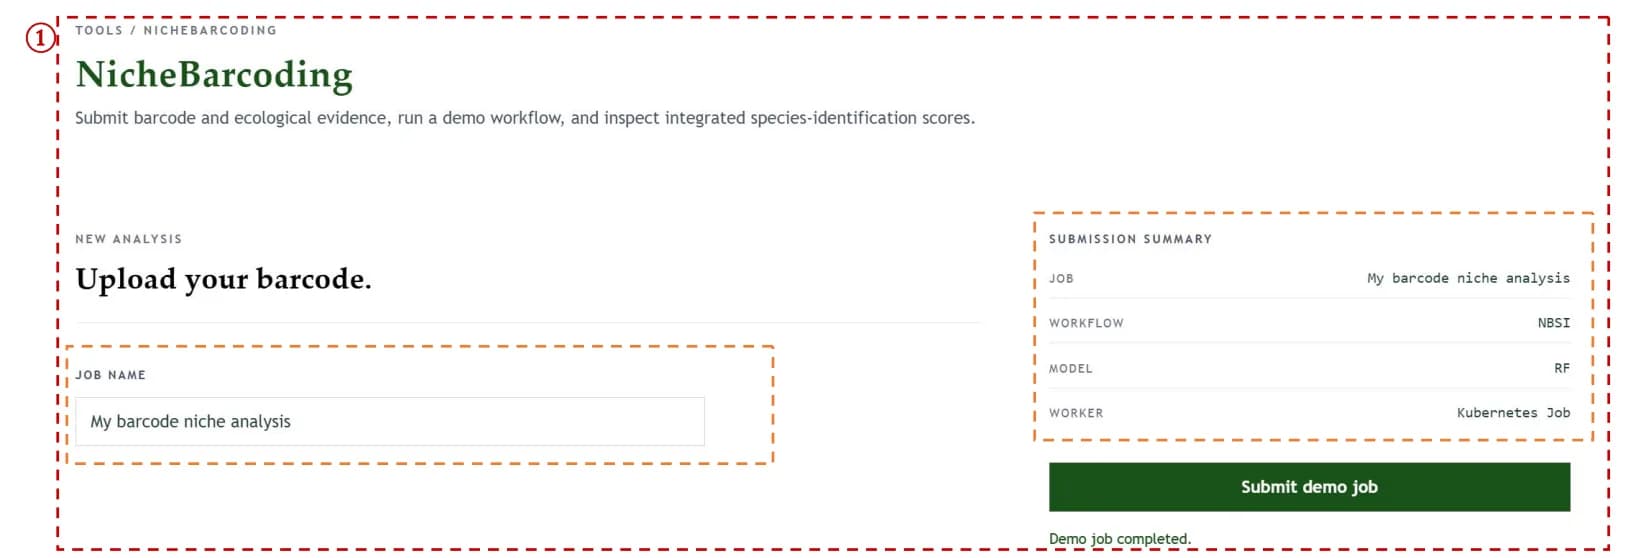
This tool performs species identification by combining DNA barcode sequences with ecological niche environmental information. Users can submit reference sequences, query sequences, geographic coordinates and environmental variables for integrated analysis.
- Upload barcode data, enter the analysis task name and submit a demo or configured job.
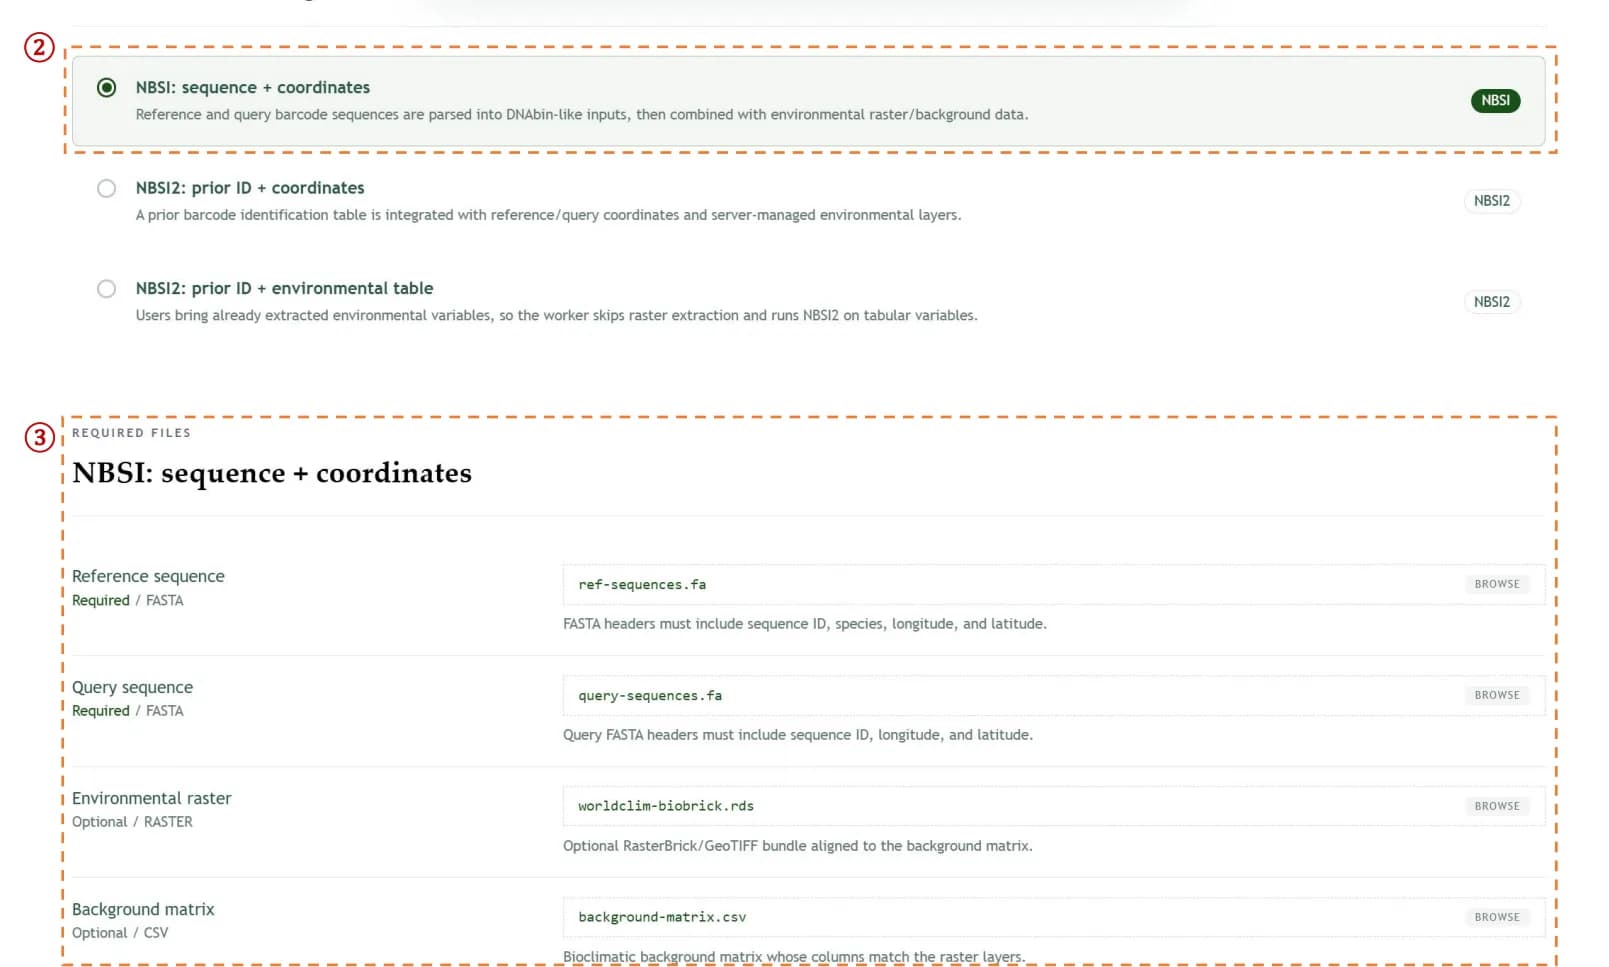
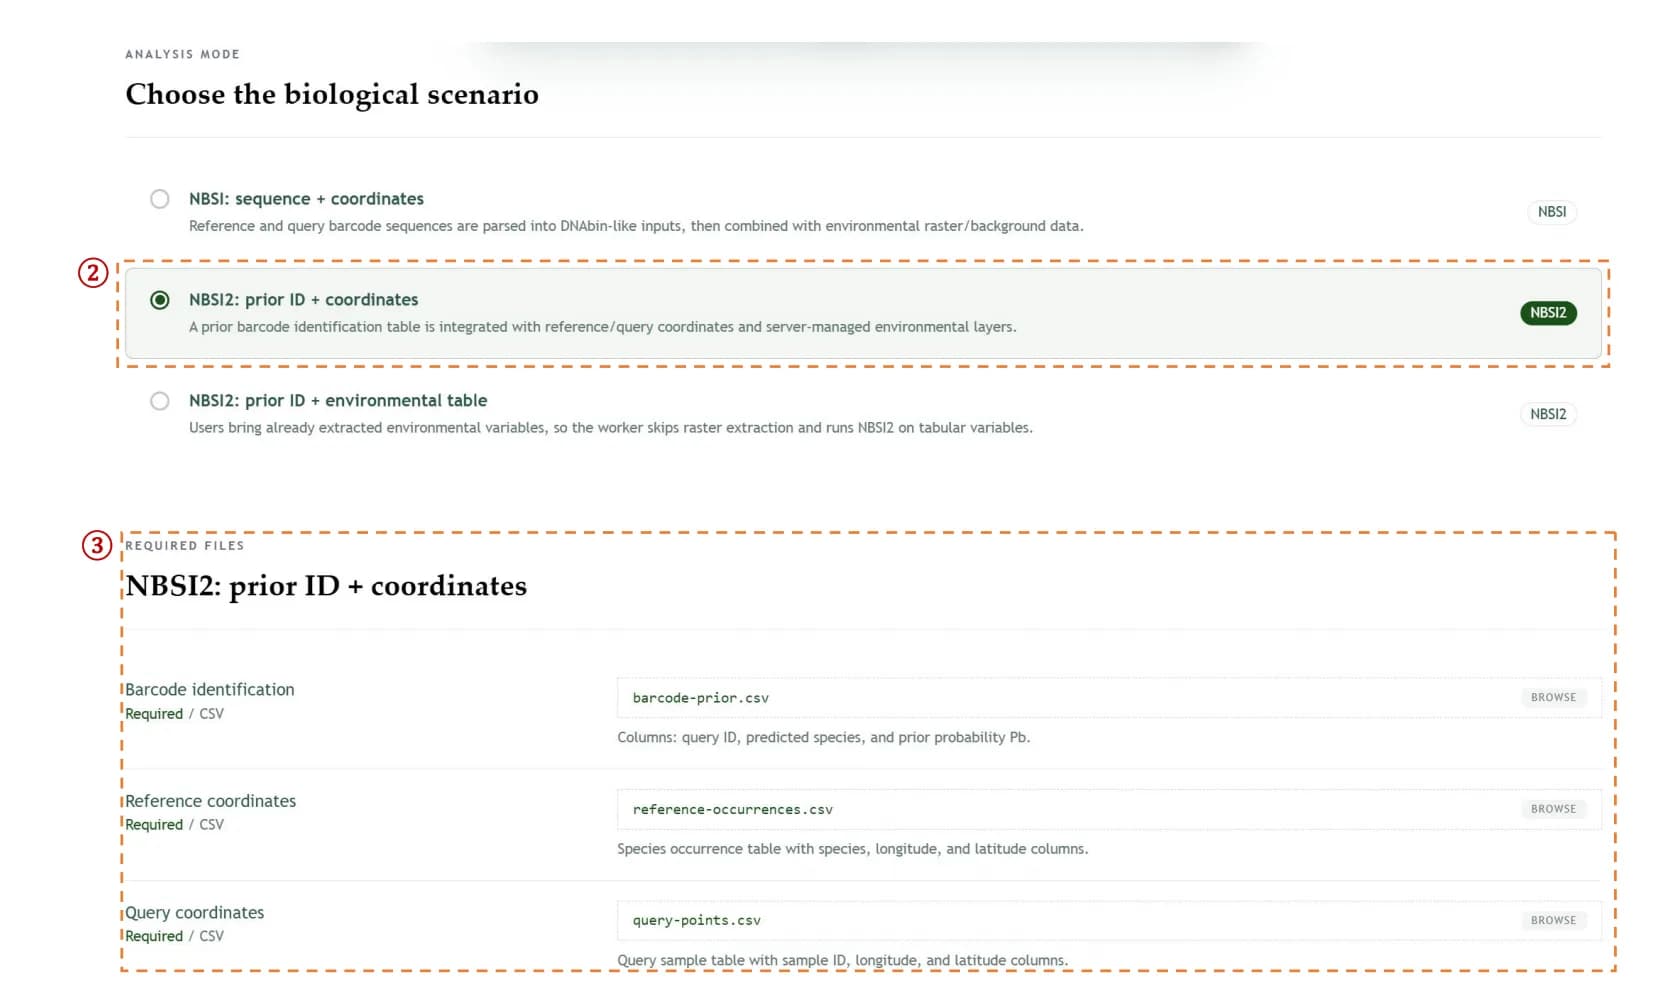
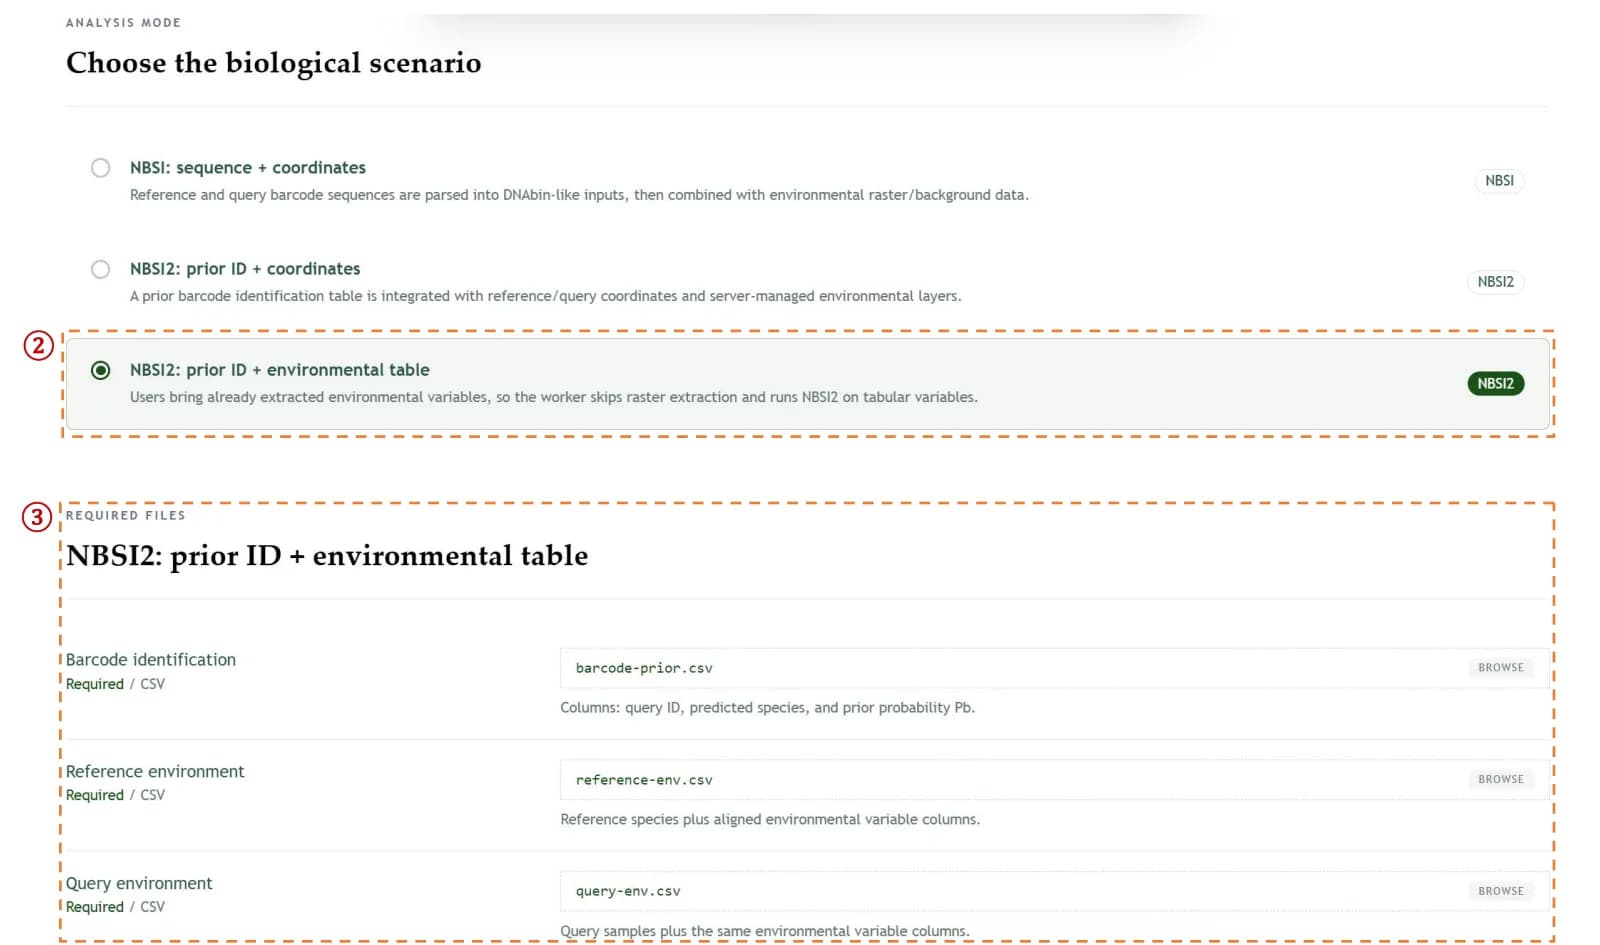
- Choose the biological scenario, including NBSI and NBSI2 workflows.
- Upload the required reference, query, coordinate, environment and background files for the selected workflow.
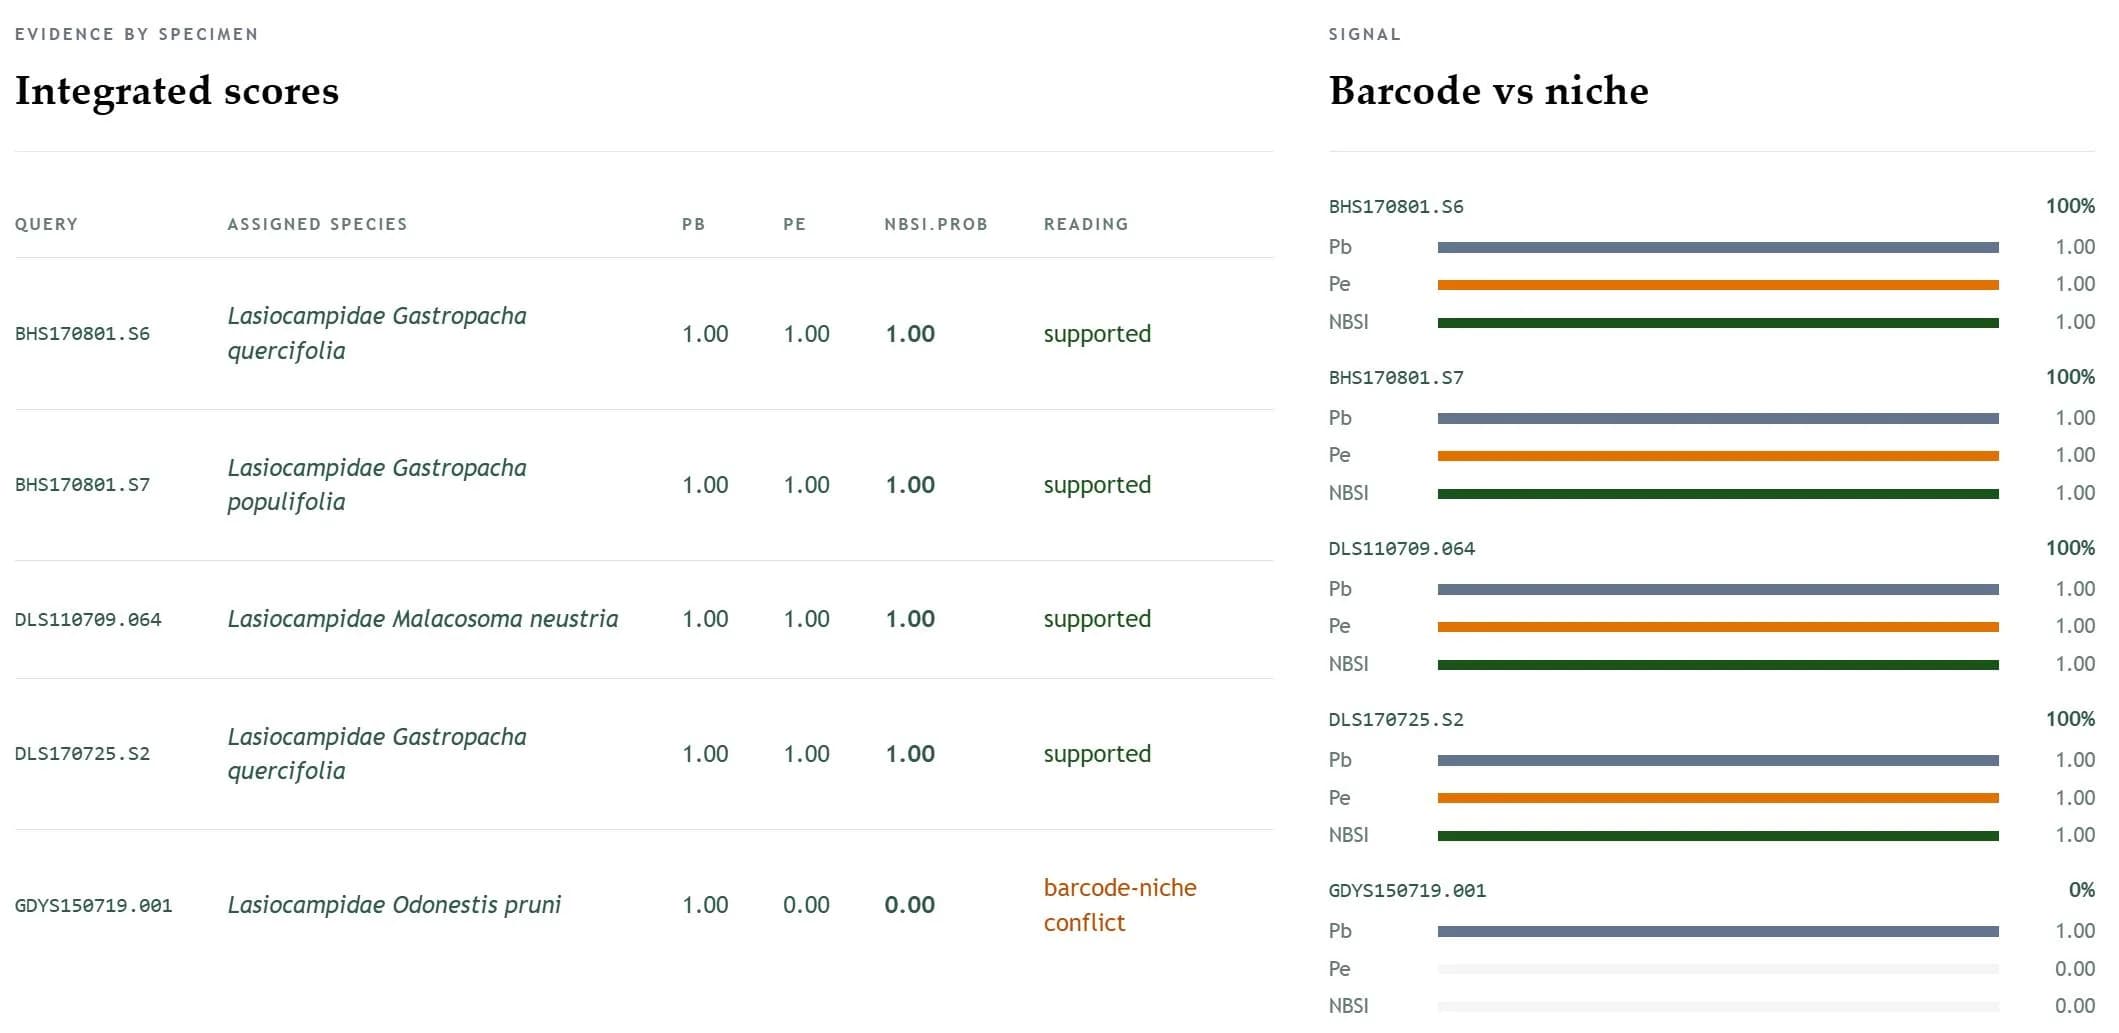
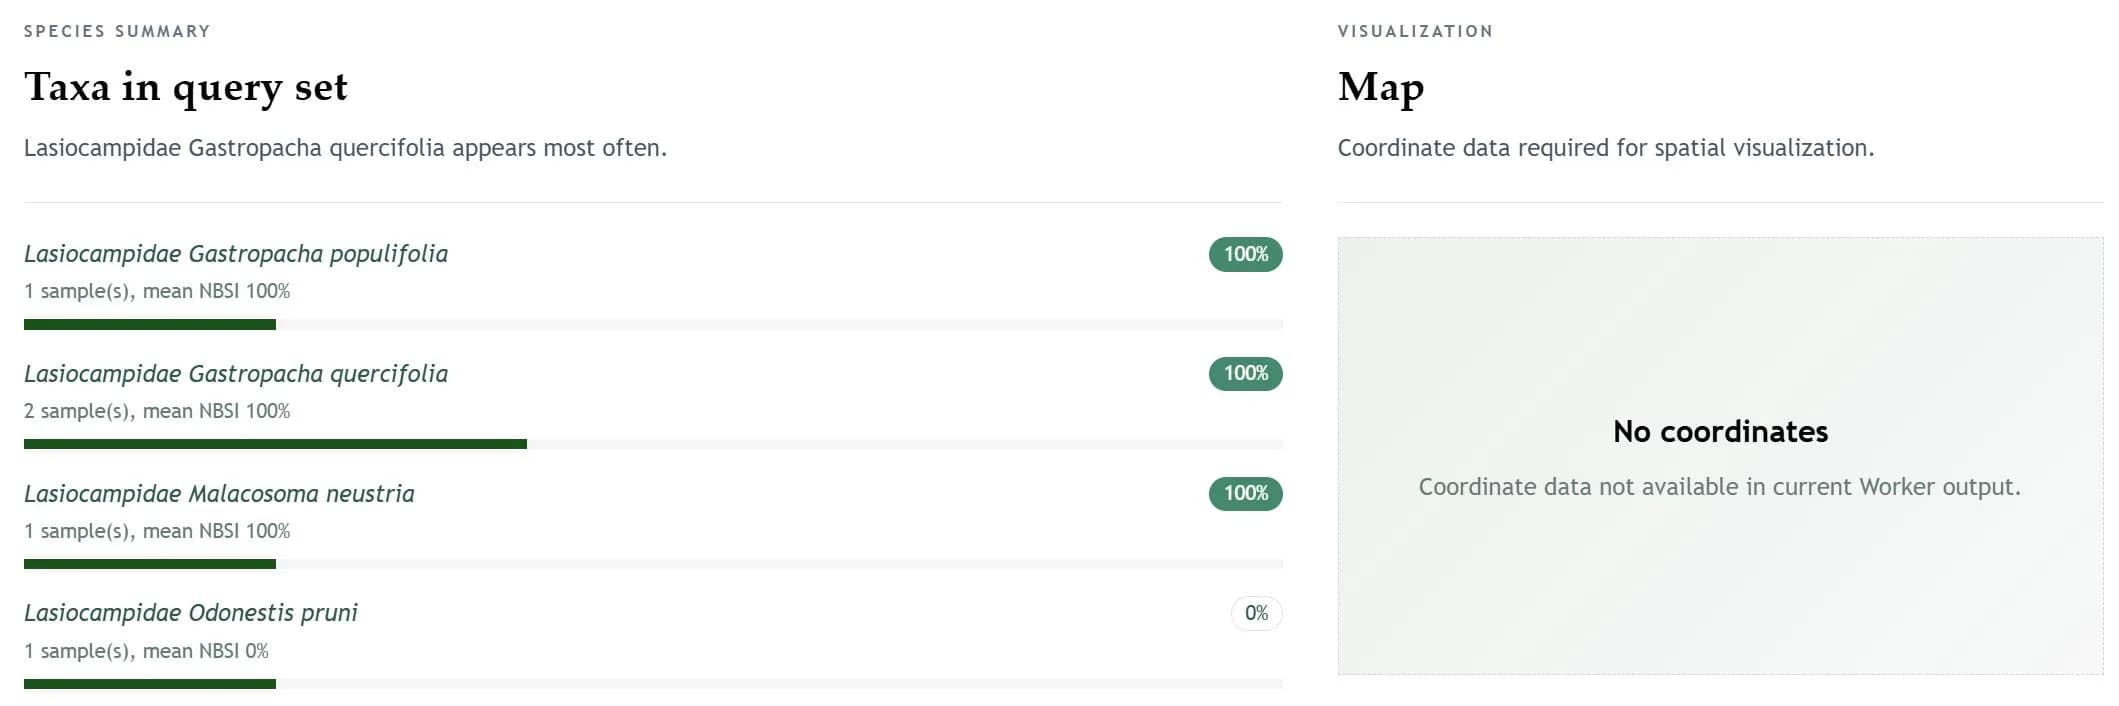
- Review biological interpretation, integrated scores, backend worker status, barcode versus niche evidence, query taxa, map output and caveats.